K-Means Cluster Analysis – Data Analysis and Intrepretation
Overview
My research work deals with Ghana, a country from the
Gapminder dataset as has already been discussed from the beginning and
progression through this course
I conducted a k-means cluster analysis to find out the
underlying sets of the population of Ghana based on their similarity of
responses on 22 variables that represent characteristics that could have an
impact on the life expectancy of Ghanaians.
All my clustering variables are quantitative and they are income per person, export rate, blood pressure in males, total population who are females, inflation, agriculture, democracy, agricultural land, aid received, male body mass index, female body mass index, under five mortality, total fertility rate, cholesterol in men, cholesterol in women, crude birth rate, dead kids per woman, external debt stocks, and energy use .
I standardized all the variables to have a mean of 0 and standard deviation of 1 prior to clustering. This will help prevent the solution being driven by variables with larger scales. This is because in Cluster analysis variables with large values contribute more to the distance calculations.
I randomly split my dataset into training dataset and test dataset with 70% being the training dataset and 30% being the test dataset. I conducted a series of k-means cluster analyses on the training data specifying k=1-9 clusters, using Euclidean distance.
Plotting the elbow curve, I get the following figure:

The Elbow curve shows the average distance relative to the number of clusters. From the curve it can be seen that the average distance decreases as the number of clusters increase. From this plot I am looking for a bend in the curve where the distance is leveling off such that adding more clusters does not decrease the average distance as much. There appears to be a couple of bends as can be seen below:

However, this is not very clear. To figure out which of the
solutions is best, we should further examine the cluster solutions for at least
the 2 and 3 cluster solutions to see whether they do not overlap where the
patterns of means on the clustering variables are unique and meaningful and
whether there are significant differences between the clusters and our external
validation variable, life expectancy of the people of Ghana.
I used Canonical discriminant analyses to reduce the 22 clustering variables down a few variables that accounted for most of the variance in the clustering variables. I ran the clusters analysis on only 3 clusters. I graphed the clusters in a Scatterplot. This is to find out whether or not they overlap with each in terms of their location in the p-dimensional space. The Scatterplot result is as below:

From the Scatterplot it can be seen that the variables are sparsely separated. This means that the observation within the clusters is less correlated and within cluster variance is very high.
I will further examine the cluster solutions. Hence I will be taking a look at the pattern of means on the clustering variables for each variable to see whether they are distinct and meaningful.
The means result can be seen as below:
From the means, it can be seen that Ghanaians in the first
cluster (cluster 0) have high income levels, high export rate, high blood pressure in males, high total population who are females, low inflation, low agriculture, high democracy, high agricultural land, high aid received, high male body mass index, high female body mass index, low under five mortality, low total fertility
rate, low cholesterol in men, low cholesterol in women, low crude birthrate , low dead kids per woman, low external debt stocks, high energy use .
From the second cluster (cluster 1) it can be seen that Ghanaians in the cluster
have low income levels, low export rate, high blood pressure in males, low
total population who are females, high inflation, high agriculture, low democracy, low agricultural land, low aid received, low male body mass
index, low female body mass index, high under five mortality, high total fertility rate, high cholesterol in men, high cholesterol in women, high crude birthrate , high dead kids per woman, low external debt stocks, low energy use
And lastly from the third cluster (cluster 2) it can be seen that Ghanaians in this cluster have low income levels, high export rate, low blood pressure in males, high total population who are females, low inflation, low agriculture, low democracy, low agricultural land, high aid received, low male body mass
index, high female body mass index, low under five mortality, low total fertility rate, low cholesterol in men, low cholesterol in women, low crude birthrate , low dead kids per woman, high external debt stocks, high energy use.
Eventually I examine how the clusters differ on the life
expectancy of the people of Ghana.
I used the Analysis of Variance (ANOVA) to test whether there are significant differences between clusters on the quantitative life expectancy variable.
The OLS Regression Results can be seen below:
From the OLS Regression Results it can be seen that the p-value = 9.71e-08 with an F-statistic: value of 52.21. The p-value is way less than the statistical alpha value of p = 0.05. Hence the test is significant. This means the cluster differs significantly on the life expectancy of the people of Ghana.
Upon examining the means of the clusters as can be seen in
the screenshot below:
Means For
Lifeexpectancy By Cluster
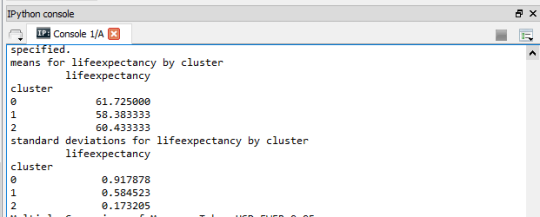
It can be seen that the population in the cluster 0 (the
first cluster) with high income levels, high export rate, low inflation, high democracy, low under five mortality, and low dead kids per woman had a high life expectancy with a mean of 61.725000 and Standard deviation of 0.917878 and the cluster 1 (the second cluster) with low income levels, low export rate, low democracy, high under five mortality, and high dead kids per woman had the lowest life expectancy with a mean of 58.383333 and Standard deviation of 0.584523
The Tukey test (which is depicted in the image below) shows that clusters differ significantly in the life expectancy of Ghanaians.
Multiple Comparison of Means – Tukey HSD,FWER=0.05

###########################################
PYTHON CODE
############################################
###########################################
CODE OUTPUT
############################################