|

Data Analytics Framework – Simple Short Notes For Aspiring Data Analysts

In the process of Data Analysis, sometimes, we are too engrossed and happy about the available data and try to jump straight into the data and make a lot of analysis and then later try to fit our analysis round business problems whether or not they exist. Hence we try to even make up problems to fit our analysis where they do not exist.


This approach is generally error-prone and will be met with various revisions as they are not always able to squarely address the problem of the organisation.

The effect is that core business problems which need addressing with analytics are pushed down the solution ladder to make way for less important problems just because those less important problems fit our not-well-frame-out-analysis.


In this succinct guide, we look at a simple framework to carry out an analytics problem at your organisation.


The essence of having a framework , is that it makes you well-organised and save you lot of time and more importantly, the core business problems are tackled squarely before moving to less important ones.

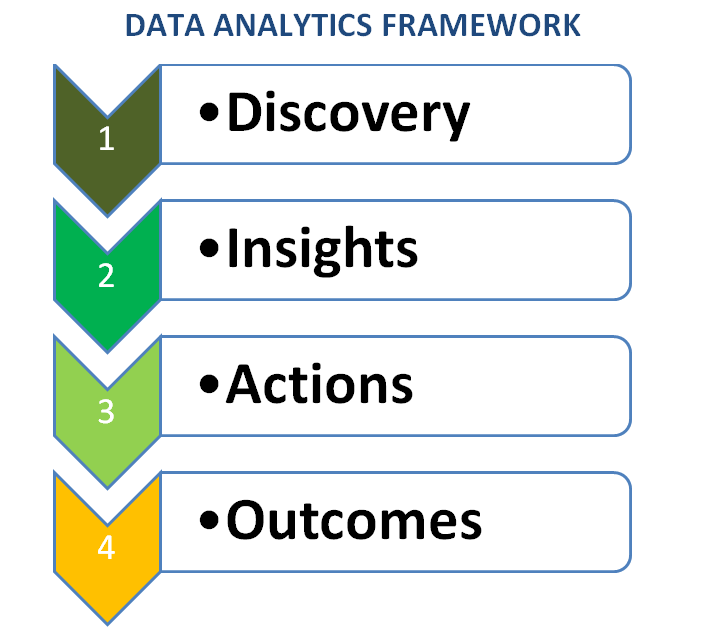
The framework is broken down into four (4) stages:

  1. Discovery: This is the first component of the framework which involves
    • defining the problem of the organisation,
    • formulating hypothesis of the problem and
    • collecting and exploring data
  2. Insights: This is where you perform your actual data analysis
  3. Actions: This component involves linking insights to actionable recommendations and creating an execution plan
  4. Outcomes: Lastly , you will have to review the outcomes of your long term objectives and solutions.

With this short guide, you can always be assured to have a well laid out approach which makes your analysis formal and be able to solve business problems squarely without wasting time merely performing analysis for analysis sake.


Want more information like this?

Similar Posts

  • | |

    Testing a Basic Linear Regression Model – Data Analysis and Intrepretation

    Testing a Basic Linear Regression Model Background My research work deals with Ghana, a country from the Gapminder dataset as has already been discussed from the beginning and progression through this course.     1)     Program  Code and Output

           #####################     OUTPUT BEGIN  #####################     Axes(0.125,0.125;0.775×0.775) Describe the centered…

  • | |

    Save Multiple Pandas DataFrames to One Single Excel Sheet Side by Side or Dowwards – XlsxWriter

      This tutorial is just to illustrate how to save Python Pandas dataframe into one excel work SHEET . You can save it column-wise, that is side by side or row-wise, that is downwards, one dataframe after the other.   In [110]:

      In [111]:


    In [112]:

      Out[112]: First Name Last Name…

  • |

    Google Data Studio is Free For Everyone: Take Your Analytics To The Next Level

    On February 2, 2017, Nick Mihailovski, Product Manager, Google Data Studio announced that Google Data Studio is now free for everyone. That the limit on 5 Reports has been removed and you can now create as many reports as you want.   He stated: “To enable more businesses to get full value from Data Studio we are making…

  • | | | | |

    Java Python R SQL Excel Compared Similarities For Data Science and Data Analytics – The Basics

    If you have ever worked with Java, Python, R, SQL, Excel and other Languages on a varied Data Science or Data Analytics projects, you will realise that all these languages have similar syntaxes, or at least, can achieve the same objective with very similar codes.   Below is a comparison and similarities of these various tools…

  • | | |

    K-Means Cluster Analysis – Data Analysis and Intrepretation

    Overview My research work deals with Ghana, a country from the Gapminder dataset as has already been discussed from the beginning and progression through this course I conducted a k-means cluster analysis to find out the underlying sets of the population of Ghana based on their similarity of responses on 22 variables that represent characteristics…

  • Structured Pyramid Analysis Plan SMART GOAL Data Analysis

    The key advice for any Data Analysis project is to never start any analysis without first having a structured plan. You should set your goals and they should be S.M.A.R.T   Below are the two charts to help with Analysis. This is part of Data Visualization and Communication with Tableau  by Duke University on Coursera. Set your…

Leave a Reply

Your email address will not be published. Required fields are marked *