| |

Simple Interactive Google Data Studio Dashboard

Google has now made Data Studio accessible and you can use it to create pretty cool data visualizations. You can find out more about the free versions and the premium versions here. Google Data Studio

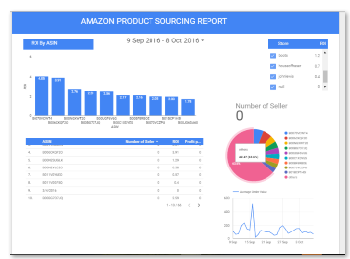
In the meantime, you can view a simple dashboard I created for Amazon Product Sourcing here:

Amazon product Sourcing Google Studio Dashboard


Snapshot below:

google-data-studio-thumb


There are much more powerful visualization and dashboard tools in Google Studio and you can join the community forum and also use the HELP CENTRE to create powerful and relevant visualizations for your company or personal use.


Want more information like this?

Similar Posts

  • |

    Quick Example and Walk-Through JSON with Python

    This is a quick to create a dictionary object , write it to a JSON file and then read back the file and convert it to a dictionary and access the items in the dictionary. Credit to : codebasics.  You can check him out on Youtube In [3]:

      In [6]:

      Out[6]:

    In [14]:…

  • |

    Installing Talend Whilst Java 1.8 Is Already Installed on Windows 10 PC

    I was installing Talend and I realised that Talend installation requires Java 1.7 or below but not any Java version above that. (as at the time of writing) The installation quit straight away, giving a notification that it requires Java 1.7 These are the steps I followed to get Talend installation to succeed. First I…

  • | |

    Testing a Basic Linear Regression Model – Data Analysis and Intrepretation

    Testing a Basic Linear Regression Model Background My research work deals with Ghana, a country from the Gapminder dataset as has already been discussed from the beginning and progression through this course.     1)     Program  Code and Output

           #####################     OUTPUT BEGIN  #####################     Axes(0.125,0.125;0.775×0.775) Describe the centered…

  • |

    Rank a Place Visited By a Customer- Microsoft SQL Server – T-Transact

    This is a short guide to getting ranking or rating from Microsoft Sql Server customers. Ranking is taken by checking how many times a customer has visited a particular country divided by the total number of travels the customer has made within the database  

        Want more information like this?

  • | | |

    FREE Mock Data Generating Website for Data Science and other Data Analysis projects

      Sometimes, you need some mock  or test data to either test your program or for your analysis or to populate your database. Or sometimes, you need some sample or mock data to illustrate or explain a concept but you do not want to use your companies’ data or your delicate data. There are a…

Leave a Reply

Your email address will not be published. Required fields are marked *