Superset Caravel BI Tool Installation and Visualizations on Heroku
Superset (formerly called Caravel ) BI Tool by http://airbnb.io/superset is a free Data Visualization tool which you can harness its powers for your visualization analytic needs.
- If you are finding problems installing on your windows PC or you simply want your own online version you can simply sign up FREE with Heroku (at least choosing their Free Plan initially) . The Free version can host your Superset BI Tool and if your needs increase later on along the line you can upgrade to their flexible advanced plans.

2. Once you are signed up, with Heroku, it will be ideal to go through their Getting Started Documentation to familiarise yourself with the Heroku platform, if you are new to it.
3. After you familiarize yourself with the platform (or if you didn’t) simple visit this link to click on the Deploy to Heroku button to install Superset in less than 5 minutes
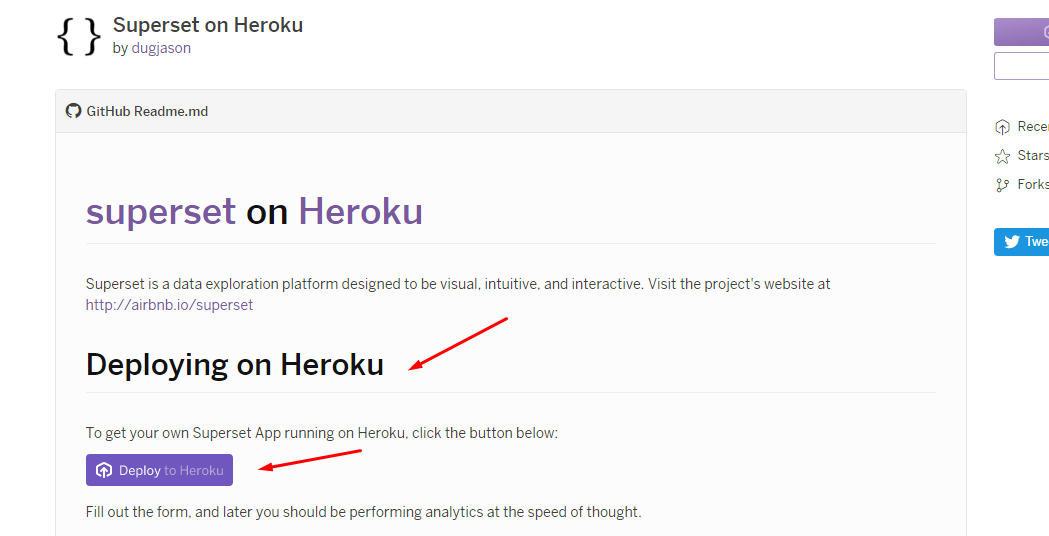
4. Give your app a name (which is your Superset url), choose your region and click on the Deploy button

5. Once it has finished installing, click on View / Open App to view your Superset / Caravel
6. You will be welcomed to your Fresh new Superset Screen
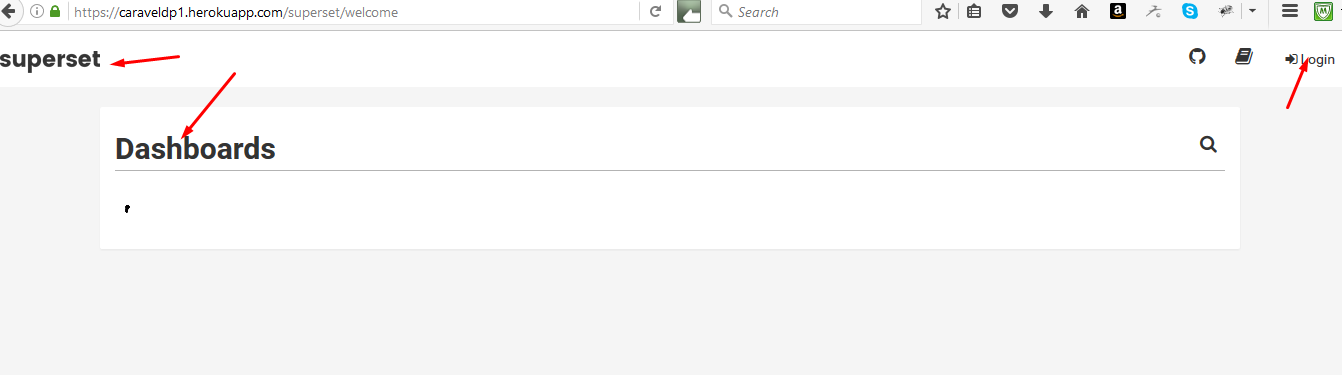
You might want to login into your BI Tool in the far right hand corner , but alas, you do not know the login details yet. You will have to create your own login now and become administrator of the tool.
This is where the initial familiarisation with the Heroku platform comes into play.
7. You will need the following steps to create your login details (this can be found at the previous link here). This the part you need from the link
” Things you should know
After deployment
- Superset will be accessible at YOURAPPNAME.herokuapp.com.
- To make changes to your app like creating admin user, clone your app locally using the Heroku Toolbelt:
|
1 |
heroku git:clone --app YOURAPPNAME |
- Create an Admin user by using
|
1 2 3 4 |
heroku run bash --app YOURAPPNAME fabmanager create-admin --app superset superset db upgrade superset init |
- Check Papertrail logs for debugging any errors.”
8. Once you are logged in, here is a good guide to get started with creating your visualisations: Click this link Superset tutorials
9. If you have challenges populating your Superset database table with data, check out this post: Populating Superset Caravel MySQL database tables with Data via Heroku
10. Below is a screenshot of a “playaround” dashboard created with Superset -Heroku installation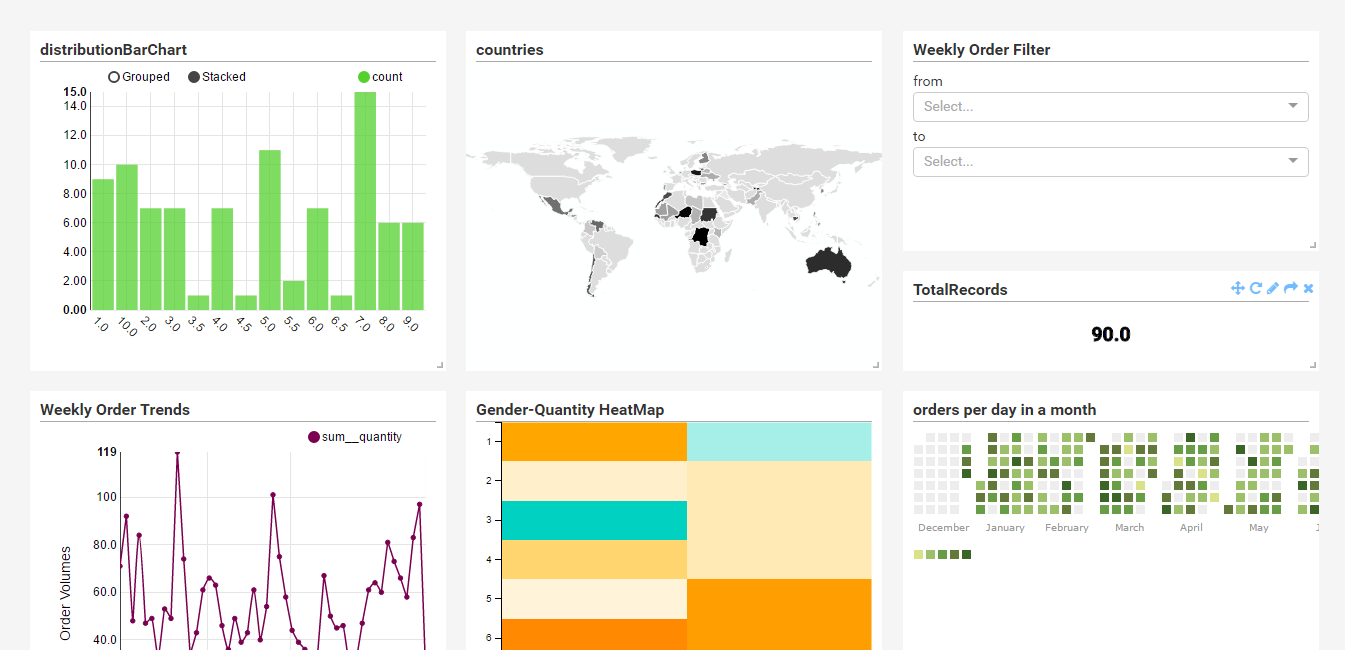
11. All the best