
Populating Superset Caravel MySQL database tables with Data via Heroku

If you installed  your Superset (Caravel) BI Tool with Heroku and if you are finding it difficult to initially populate your MySQL database tables with Data and you will be using MySQL the default database that come with your installation, then you can follow these steps to get data into Superset.

(By the way, you may visit this post on quick guide to installing Superset with Heroku: Superset Caravel BI Tool Installation and Visualizations on Heroku)

  1. Log into your Heroku account and in the far right hand corner locate your account and click on Dashboard 
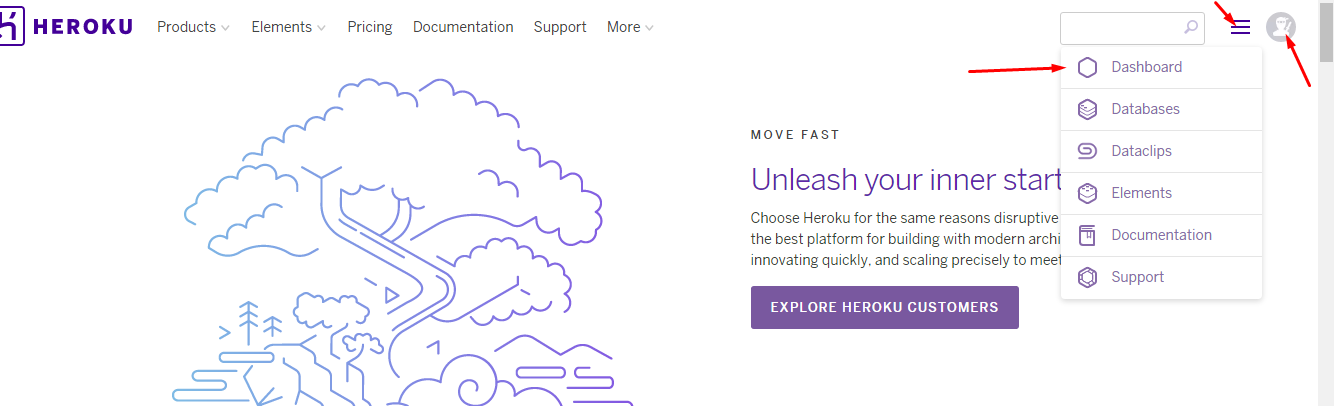
  2. You will see all your apps in the dashboard. 
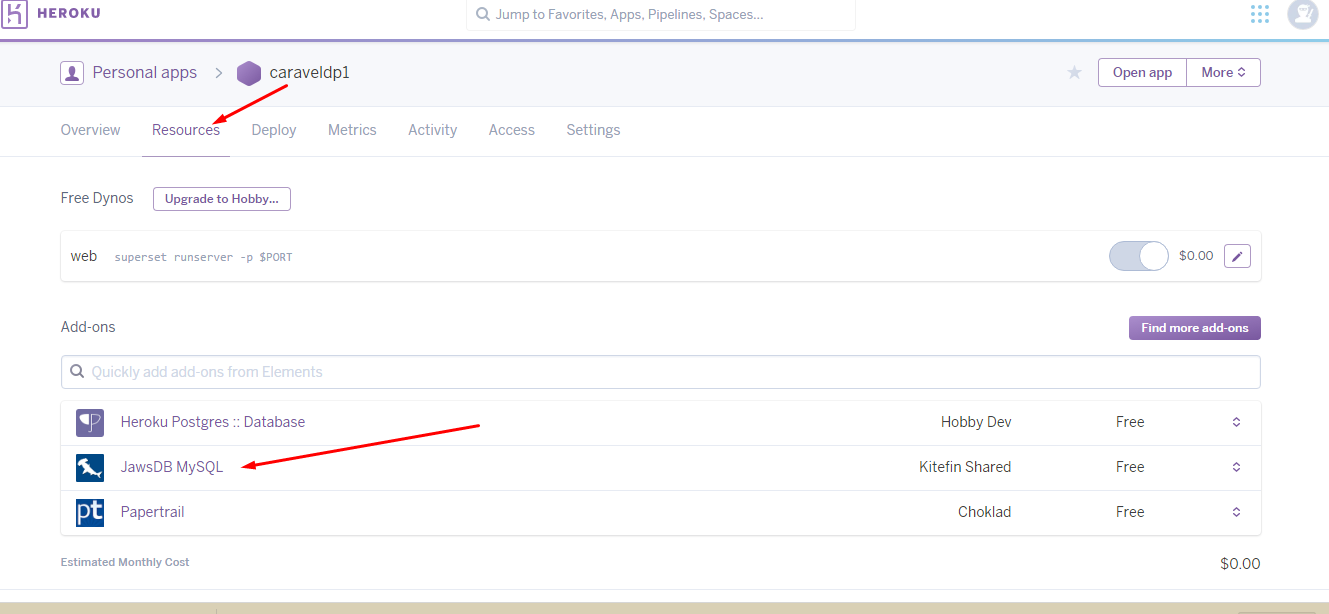
  3. Click on Resources and click the “JawsDB MySQL” database. 
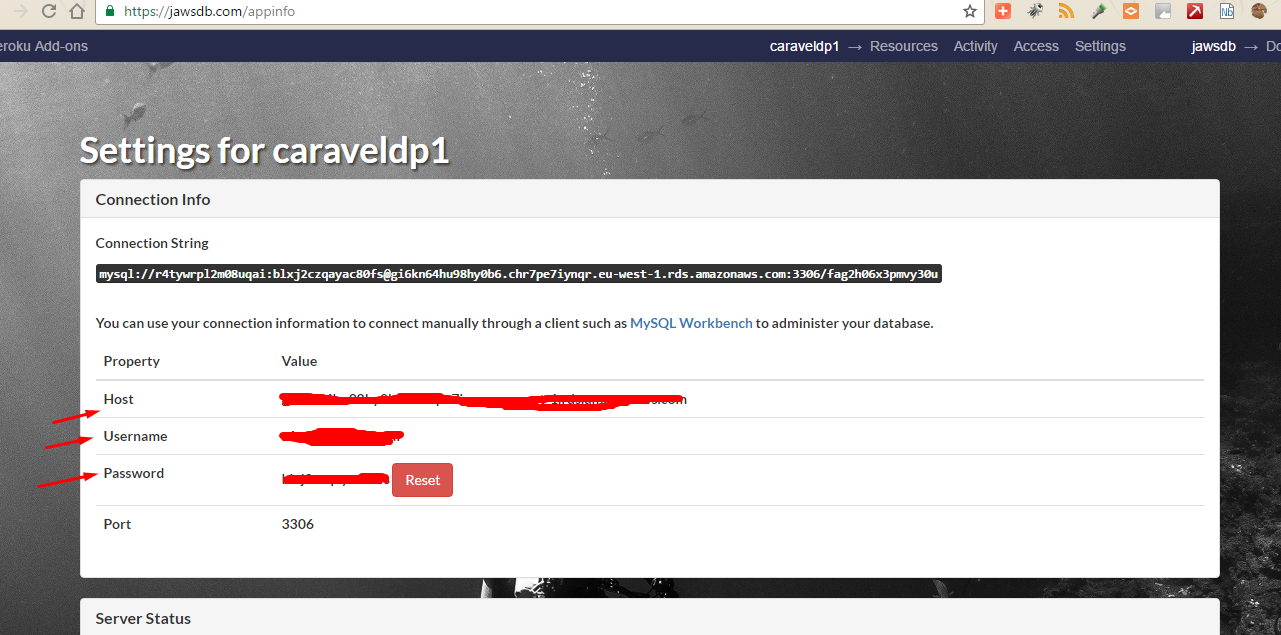
  4. You will get a window which will give  you all the parameters you will need to connect to  your Superset MySQL database 
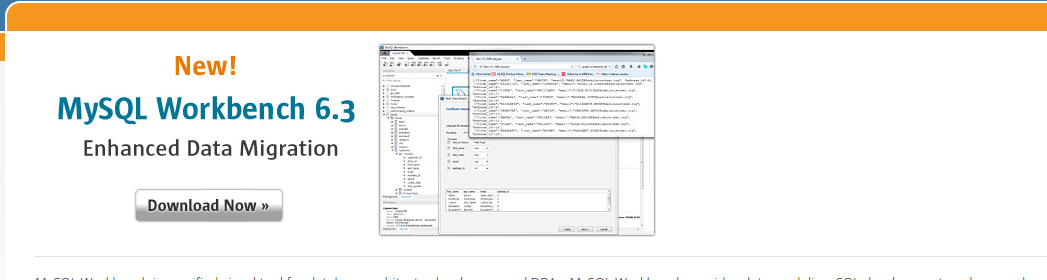
  5. Follow the onscreen instruction and download and install MySQL Workbench 
  6. Once the MySQL Workbench is installed , you can now use the connections parameters provided to connect the workbench to your Superset MySQL database hosted on Heroku 
  7. Once you have filled all the sections and you have tested the connection and it works fine, connect to the database and check the schema inside the WorkBench
  8. The schema you will see in the MySQL Workbench will be same schema you will find in your Superset database. Example is as in this 
  9. Now you can create your tables in the schema and insert data into it all inside the Workbench. (If you want to experiment with sample data, you can generate some from here with a complete insert statements. Visit this site) After that click on the refresh button next to the word SCHEMA. 
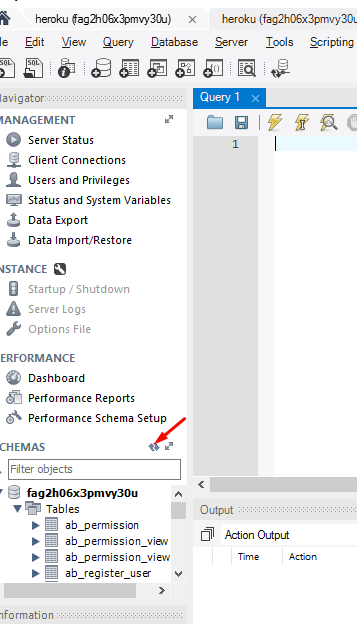
  10.  You can preview your newly created table and check your data in the WorkBench 
  11. Once data is showing fine in your MySQL Workbench you can visit SuperSet SQL Lab and check your data showing there 
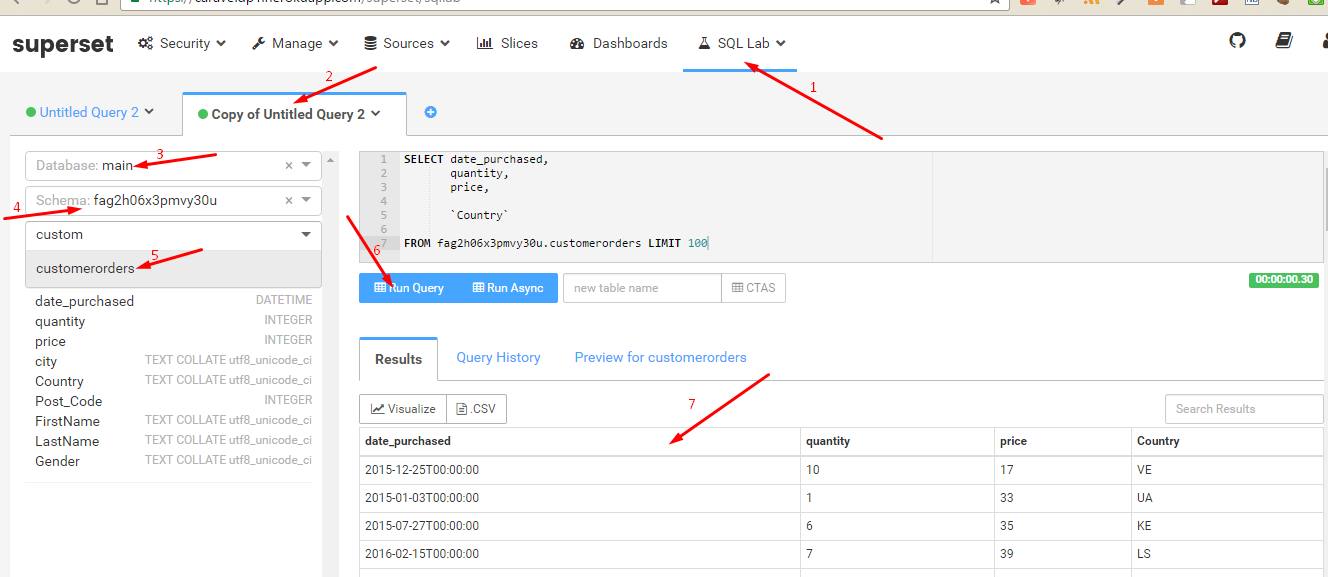
  12. You can then follow the Superset tutorial to start your visualizations
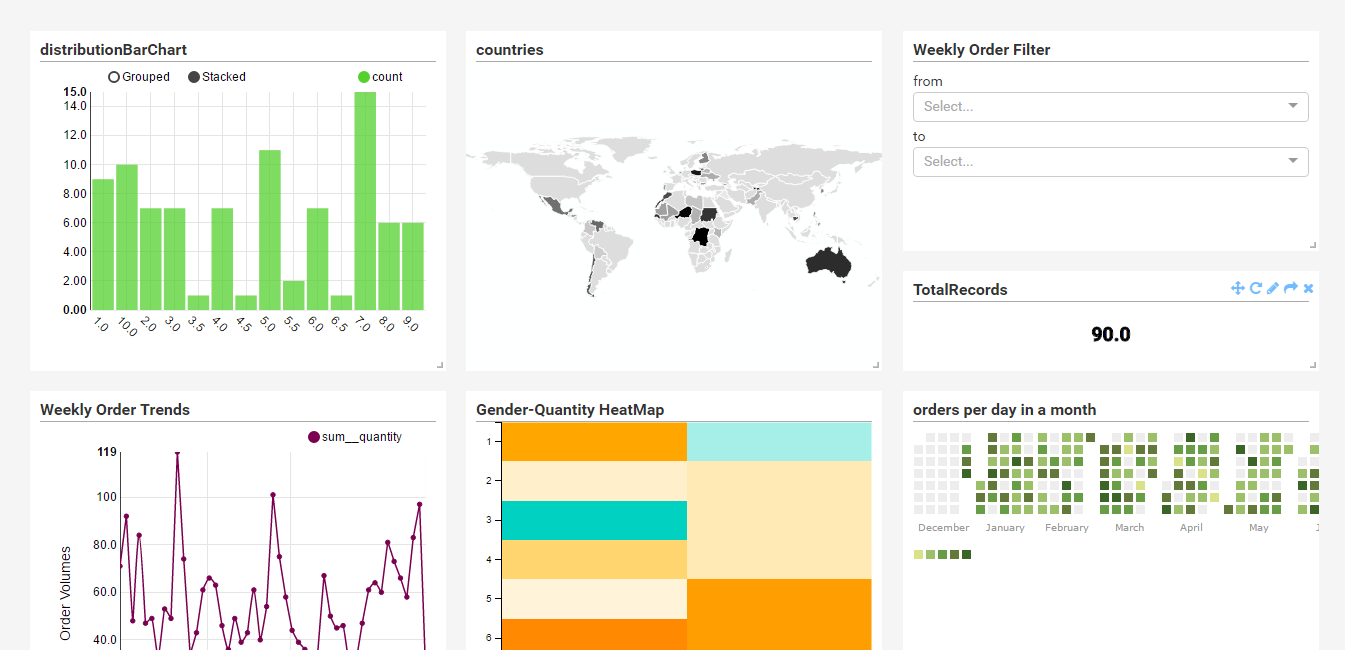
  13. Below is a “playaround” dashboard, generated with Superset installation on Heroku
Want more information like this?
Similar Posts

  • | |

    Save Multiple Pandas DataFrames to One Single Excel Sheet Side by Side or Dowwards – XlsxWriter

      This tutorial is just to illustrate how to save Python Pandas dataframe into one excel work SHEET . You can save it column-wise, that is side by side or row-wise, that is downwards, one dataframe after the other.   In [110]:

      In [111]:


    In [112]:

      Out[112]: First Name Last Name…

  • |

    R Shiny App for Mining Fields Evaluation

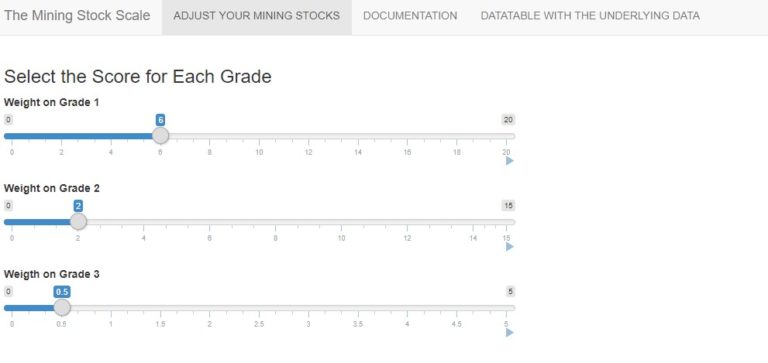
    Presenting your report in an interactive and user-friendly way is a very effective communicative tool which can help you convey message to your audience easily. R is a very powerful analytic tool which helps you to do that with the “shiny” package. Here, I simply look at an app about the Mining Fields Evaluation which was…

  • | |

    Entity Relationship Diagram – ERD and Cardinality Symbols Simple Explanations

    Understading cardinality notation and being able to explain them will go a long way in your database design and implementation. Here we look at a simple explanation of the symbols. (Credit to Data Warehousing for Business Intelligence by University of Colorado System on Coursera) Symbols in the above diagram and their meanings: – Oval: means 0 –…

  • |

    Superset Heroku Installation – Microsoft SQL Server Database Connection on Windows PC

     Clone this github repository into YOUR OWN repository and Edit the link in the  Readme.md file from https://www.herokucdn.com/deploy/button.svg)](https://heroku.com/deploy?template=https://github.com/dugjason/superset-on-heroku to the link in YOUR OWN CLONED repository eg. https://www.herokucdn.com/deploy/button.svg)](https://heroku.com/deploy?template=https://github.com/benadaba/hrmr Now scroll down and COMMIT (save) the changes ALSO edit the requirements.txt file and include any database requirements you want installed . eg pymssql==2.1.3, pyodbc==4.0.21 (this version was generating an…

  • Matplotlib Pyplot Plt Python Pandas Data Visualization Plotting

      This is some quick notes about graphing or plotting graphs with Matplotlib in Python. Credits to sentdex.  You can check him out on Youtube.

      In [4]:

      In [10]:

      In [14]:

      In [20]:

      In [23]:

      In [30]:

      Out[30]:

    In [48]:

        Want more information like this?

  • Structured Pyramid Analysis Plan SMART GOAL Data Analysis

    The key advice for any Data Analysis project is to never start any analysis without first having a structured plan. You should set your goals and they should be S.M.A.R.T   Below are the two charts to help with Analysis. This is part of Data Visualization and Communication with Tableau  by Duke University on Coursera. Set your…

Leave a Reply

Your email address will not be published. Required fields are marked *