|

Free Open Source Data Visualization Tools and Service

There are a couple Free Open Source Data Visualization Tools and Services which you can make use of for your work data exploration and visualization purposes.

Below ,  I list a few ones in no order of importance.
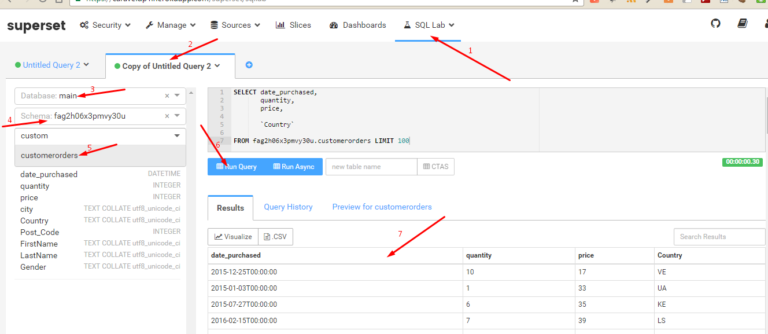
  1. Caravel:   caravel-by-airbnbIt is a Python based data exploration and visualization software by Airbnb. It is powerful and open source. Check this post on how to Freely install it with Heroku:  Superset Caravel BI Tool Installation and Visualizations on Heroku

2. Metabase:

metabase

It is very easy to install and very user-friendly. The developers want everyone at your company to be ask and answer their data related question without needing to necessary know any coding.


I have not included Tableau and the likes , as the free versions only allows you to publish to the cloud and your company does not have much control over who sees your data and analysis.

Which 100% Free Open Source Data Visualization tools do you use? You can share in the comment box below:


Want more information like this?

Similar Posts

  • |

    DataSets Around the Web For Big Data, Machine Learning and DataScience Practices

    Here is a collection of several DataSet repositories, I have come across the web. ( I will adding more along the way) You can add to this by commenting on the post and I will update it in the this list Google Dataset Search : This is a great tool released by Google to help…

  • Matplotlib Pyplot Plt Python Pandas Data Visualization Plotting

      This is some quick notes about graphing or plotting graphs with Matplotlib in Python. Credits to sentdex.  You can check him out on Youtube.

      In [4]:

      In [10]:

      In [14]:

      In [20]:

      In [23]:

      In [30]:

      Out[30]:

    In [48]:

        Want more information like this?

  • | |

    Connect Push Commit Pull Your GitHub Repository To Your Local Computer’s Directory

    Introduction Github is a web version control system which is very useful when you are working on various projects or you want to keep track of changes you make to your project over time. It is a very useful tool as you venture into Data Science and Programming   Objective After you have created a…

  • Simple Python Logging Callling Reload to Help Save Logging to File

      In this notes, we are looking at a simple but yet useful and powerful logging in Python In [77]:

      In [78]:

      In [79]:


      Want more information like this?

  • | | |

    K-Means Cluster Analysis – Data Analysis and Intrepretation

    Overview My research work deals with Ghana, a country from the Gapminder dataset as has already been discussed from the beginning and progression through this course I conducted a k-means cluster analysis to find out the underlying sets of the population of Ghana based on their similarity of responses on 22 variables that represent characteristics…

One Comment

Leave a Reply

Your email address will not be published. Required fields are marked *