Business Intelligence - BI
Bernard Adabankah

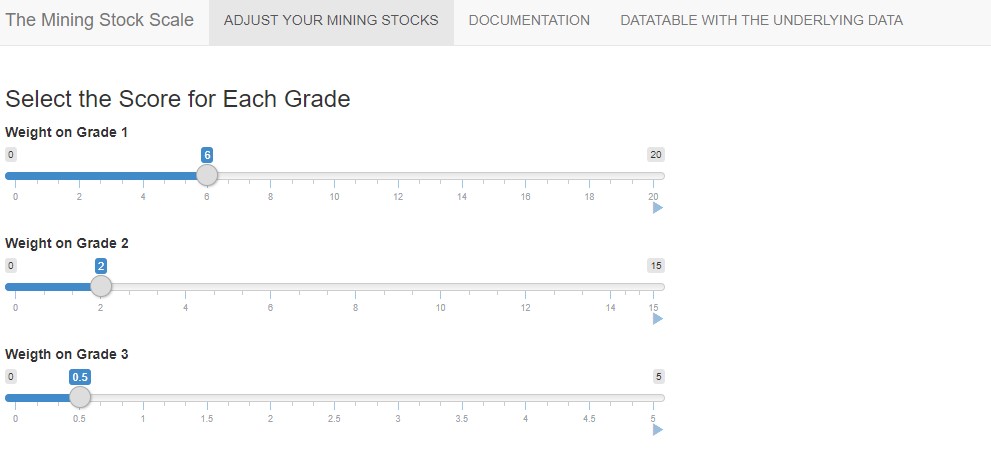
R Shiny App for Mining Fields Evaluation

Presenting your report in an interactive and user-friendly way is a very effective communicative tool which can help you convey message to your audience easily. R is a very powerful analytic tool which helps you to do that with the “shiny” package. Here, I simply look at an app about the Mining Fields Evaluation which was

Read More »
Business Intelligence - BI
datapandasadmin

Superset Heroku Installation – Microsoft SQL Server Database Connection on Windows PC

 Clone this github repository into YOUR OWN repository and Edit the link in the  Readme.md file from https://www.herokucdn.com/deploy/button.svg)](https://heroku.com/deploy?template=https://github.com/dugjason/superset-on-heroku to the link in YOUR OWN CLONED repository eg. https://www.herokucdn.com/deploy/button.svg)](https://heroku.com/deploy?template=https://github.com/benadaba/hrmr Now scroll down and COMMIT (save) the changes ALSO edit the requirements.txt file and include any database requirements you want installed . eg pymssql==2.1.3, pyodbc==4.0.21 (this version was generating an

Read More »
Business Intelligence - BI
datapandasadmin

Google Data Studio is Free For Everyone: Take Your Analytics To The Next Level

On February 2, 2017, Nick Mihailovski, Product Manager, Google Data Studio announced that Google Data Studio is now free for everyone. That the limit on 5 Reports has been removed and you can now create as many reports as you want.   He stated: “To enable more businesses to get full value from Data Studio we are making

Read More »
Business Intelligence - BI
datapandasadmin

Creating a Gantt Chart Graph In Excel

Let’s assume we have some simple goals we want to achieve. Lets set our goals as follows: We enter our goals / targets in column 1. We have to set up our table correctly to make the Gantt chart creation easier and straight forward for us. We enter our goals in column B In column

Read More »

Entity Relationship Diagram – ERD and Cardinality Symbols Simple Explanations

Understading cardinality notation and being able to explain them will go a long way in your database design and implementation. Here we look at a simple explanation of the symbols. (Credit to Data Warehousing for Business Intelligence by University of Colorado System on Coursera) Symbols in the above diagram and their meanings: – Oval: means 0 –

Read More »
Business Intelligence - BI
datapandasadmin

Superset Caravel BI Tool Installation and Visualizations on Heroku

Superset (formerly called Caravel ) BI Tool by  http://airbnb.io/superset  is a free Data Visualization tool which you can harness its powers for your visualization analytic needs. If you are finding problems installing on your windows PC or you simply want your own online version you can simply sign up FREE with Heroku (at least choosing

Read More »
Business Intelligence - BI
datapandasadmin

Populating Superset Caravel MySQL database tables with Data via Heroku

If you installed  your Superset (Caravel) BI Tool with Heroku and if you are finding it difficult to initially populate your MySQL database tables with Data and you will be using MySQL the default database that come with your installation, then you can follow these steps to get data into Superset. (By the way, you

Read More »