Rank a Place Visited By a Customer- Microsoft SQL Server – T-Transact

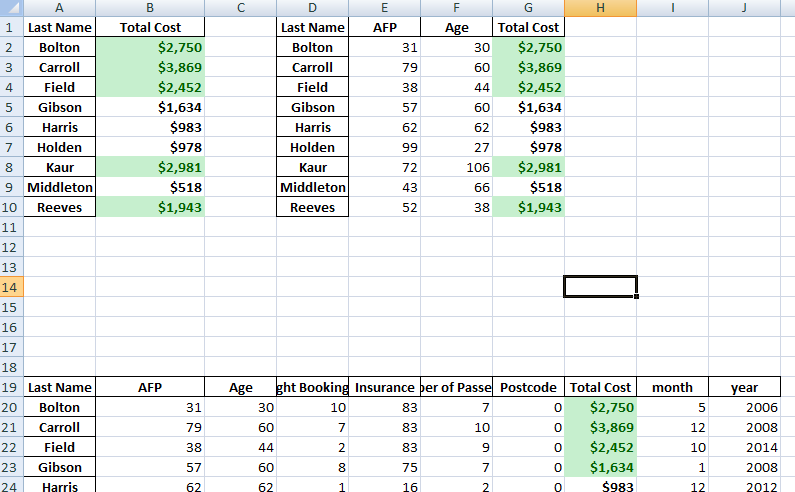
This is a short guide to getting ranking or rating from Microsoft Sql Server customers. Ranking is taken by checking how many times a customer has visited a particular country divided by the total number of travels the customer has made within the database   /*make a back up of the recommender rankings table*/ truncate

Read More »

Automatically Open Excel and Send Report Using Batch and VBA

  We can use Visual Basic codes to automate some reports in Excel. Below are some simple codes to do this. First this is a batch file to open our Excel report called “data report.xlsm”, assuming the report file is in the same folder as the batch file. You can schedule the time this batch file is

Read More »
Business Intelligence - BI
datapandasadmin

Free Open Source Data Visualization Tools and Service

There are a couple Free Open Source Data Visualization Tools and Services which you can make use of for your work data exploration and visualization purposes. Below ,  I list a few ones in no order of importance. Caravel:   It is a Python based data exploration and visualization software by Airbnb. It is powerful and

Read More »
Business Intelligence - BI
datapandasadmin

Simple Interactive Google Data Studio Dashboard

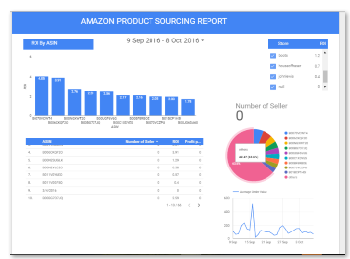
Google has now made Data Studio accessible and you can use it to create pretty cool data visualizations. You can find out more about the free versions and the premium versions here. Google Data Studio In the meantime, you can view a simple dashboard I created for Amazon Product Sourcing here: Amazon product Sourcing Google Studio

Read More »

Structured Pyramid Analysis Plan SMART GOAL Data Analysis

The key advice for any Data Analysis project is to never start any analysis without first having a structured plan. You should set your goals and they should be S.M.A.R.T   Below are the two charts to help with Analysis. This is part of Data Visualization and Communication with Tableau  by Duke University on Coursera. Set your

Read More »