Basic Plotting Using Bokeh Python Pandas Library – Scatter, Line Visualizations
Bokeh is a powerful framework for data visualization in Python. Here I take a look at straightforward plotting and visualization using this powerful library.
Credit to PythonHow. You can check him out on Youtube
bokeh.models #It is a low level interface which involves a lot of work
bokeh.plotting # It is a middle level interface
bokeh.chart # It is a high level interface
Lets try to create scatter plot
|
1 2 |
from bokeh.charts import Scatter, output_file, show import pandas as pd |
lets create a dataframe and add some values to it for our plot
|
1 |
df = pd.DataFrame(columns=['X','Y']) |
lets add some values to the X and Y axis
|
1 2 |
df['X'] = ['1','2','3','4','5']# df['Y'] = ['5','6','4','5','3'] |
lets store the scatterplot in a variable
|
1 |
p = Scatter(df, x='X', y='Y', title='Temperature observation', xlabel='Day of Observation', ylabel='Temperature', logo=None) |
we can save our file as html using the output_file method and we can also show our plot using the show method
|
1 |
output_file('scatterplot.html') |
|
1 |
show(p) |
lets now plot using the bokeh.plotting interface
lets import the figure object from the plotting interface as that is the main object we will be using to plot. the idea is that you make an empty figure and you add objects to it
|
1 |
from bokeh.plotting import figure, output_file, show |
lets store the figure object in a variable. we can set the with and height of the figure or we can leave it blank to use defaut with
and height
|
1 |
p = figure(plot_width=500, plot_height= 500, title='EarthQuakes',logo=None) # logo = None removes the bokeh.logo |
you can also customise the plot
|
1 2 3 4 5 |
p.title_text_color = 'orange' p.title_text_font_style = 'italic' p.title_text_font = 'times' p.yaxis.axis_label = 'Values' p.xaxis.axis_label = 'Time' |
let’s use the circle method to plot our scatter plots. the circle method takes array of X and Y values. You can also set the size of the scatter circles
|
1 2 3 |
p.circle(df['X'],df['Y'], size = [i*2 for i in ['2','4','3','6','9']] , color ='green', alpha=0.5) #alpha controls opacity #p.triangle(df['X'],df['Y'], size = 8 , color ='green', alpha=0.5) #alpha controls opacity |
You can use a list to determine the size each X,Y pair of plot
|
1 2 |
output_file('scatterplotting.html') show(p) |
you can get a full HELP with the p variable by typing help(p)
|
1 |
help(p) |
lets plot some time series data
|
1 |
df = pd.read_csv('stock.csv',parse_dates=['Date']) |
|
1 |
p = figure(width=500, height=300, x_axis_type='datetime', responsive=False) # declare the x-axis as a time series axis |
responsive = True enlarges the whole graph to cover the screen
lets plot with a line graph
|
1 2 3 |
p.line(df['Date'],df['Close'], alpha=0.5) p.line(df['Date'],df['Open'], alpha=0.5, color='red') p.circle(df['Date'],df['Adj Close'], alpha=0.5, color='green') |
lets save the file and also show it
|
1 2 3 |
output_file('linegraph.html') show(p) |
People Who Read The Above Post Also Read This:
 Python Pandas Pivot Table Index location Percentage calculation on Two columns – XlsxWriter pt2
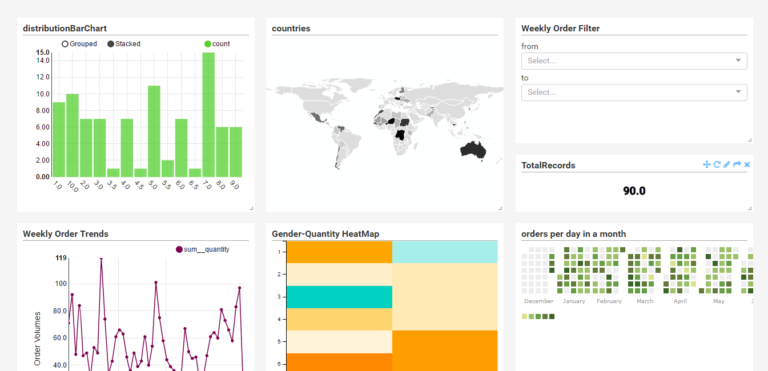
 Python Bokeh plotting Data Exploration Visualization And Pivot Tables Analysis
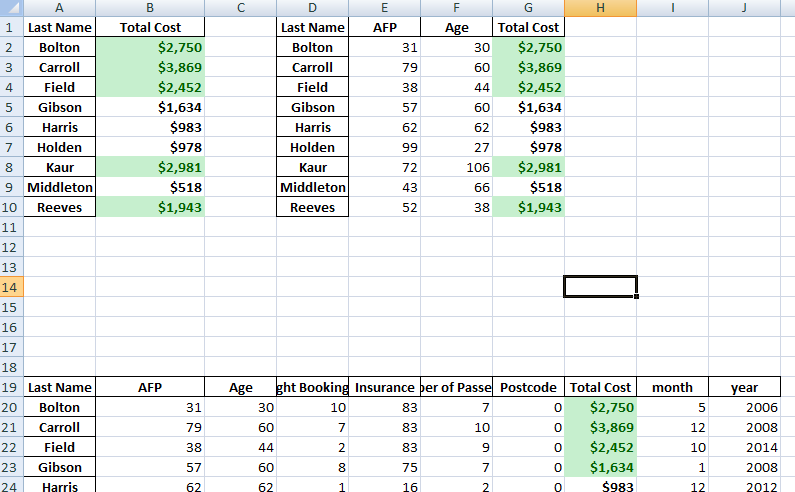
Save Multiple Pandas DataFrames to One Single Excel Sheet Side by Side or Dowwards – XlsxWriter
Python Bokeh plotting Data Exploration Visualization And Pivot Tables Analysis
Save Multiple Pandas DataFrames to One Single Excel Sheet Side by Side or Dowwards – XlsxWriter