| | |

Deploy Productionalise Azure Machine Learning Algorithm Using Python

This is a script to consume Azure Machine Learning Model which you build using Azure ML Studio.

So basically this is a Request-Response Service (RRS)  according to Microsoft.

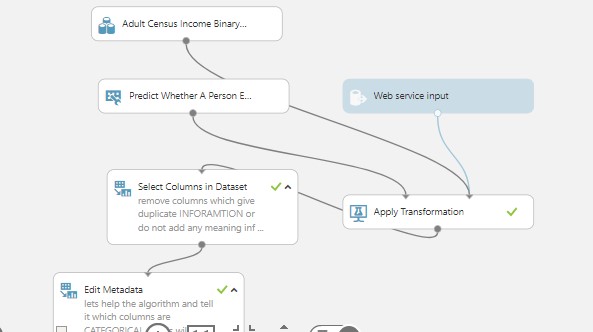
This was a Boosted Decision Tree Algorithm build with Census Adult Data which is available as one of the Sample DataSet in Azure ML.

You can adapt the code to suit your need as this is a guide.

For large file batch predictions, you might have to use the Batch Execution Service (BES) instead.


The sample data associated with this example can be downloaded from here


Hope this helps.

Please ask your questions in the comment box below

Want more information like this?

Similar Posts

  • Matplotlib Pyplot Plt Python Pandas Data Visualization Plotting

      This is some quick notes about graphing or plotting graphs with Matplotlib in Python. Credits to sentdex.  You can check him out on Youtube.

      In [4]:

      In [10]:

      In [14]:

      In [20]:

      In [23]:

      In [30]:

      Out[30]:

    In [48]:

        Want more information like this?

  • | |

    Exploring Statistical Analysis in the Context of Correlation – Testing a Potential Moderator

    Exploring Statistical Analysis in the Context of Correlation   Chosen Dataset I will be working with Data from the Gapminder dataset. This happens to be the same dataset I worked with under the Data Management and Visualization course assignments. As elaborated and discussed in under the Data Management and Visualization course assignments, I have chosen to focus on the country,…

  • |

    Examining The Structure of A Data Science Project

    It is really ideal that you define the structure of your Data Science project before beginning the project. The Data Science Project can take a couple of structures, however this is a high level guide which can help you structure and remain focused with your Data Science project Structure Credit: JHU @Coursera.   Also this…

  • |

    Test a Multiple – Multivariate Regression Model

    OVERVIEW My research work deals with Ghana, a country from the Gapminder dataset.   What I found in my multiple regression analysis. Discussion of the results for the associations between all of my explanatory variables and my response variable The primary quantitative explanatory variable in my regression analysis is the Income Per Person (incomeperperson) and…

  • Python Bokeh plotting Data Exploration Visualization And Pivot Tables Analysis

    This is a quick walk through Bokeh data exploration and visualization and also python pivot_tables (credit to pbpython on the pivot_tables).Visualization Dashboard In [49]:

      In [50]:


    In [51]:

      Out[51]: First Name Last Name Sex Phone Fax Email Address Booking Date Departure Date Arrival Date Address1 … Number of Passengers Total Cost Currency…

Leave a Reply

Your email address will not be published. Required fields are marked *