Read_csv Is Not Returning A Dataframe Python Pandas
str is not callable python

I was working with a CSV file on a project and after reading the CSV into the Program with the pandas.read_csv function the returned data type seemed not be a Dataframe for some reason

code was as follows:

sample = pd.read_csv(‘sample.csv’)

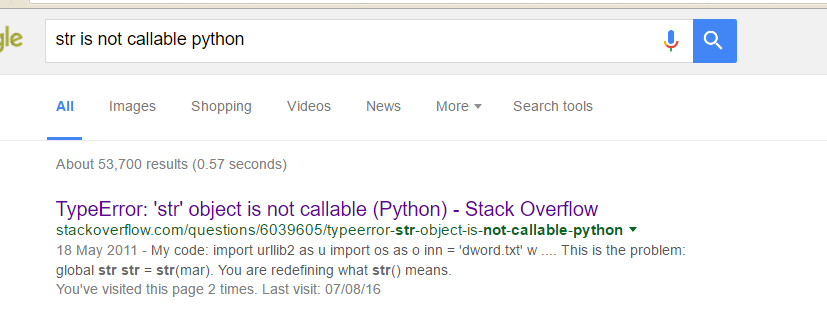
When i tried to run some functions on the supposed ‘returned dataframe object -sample’ I get an error which states- TypeError: ‘str’ object is not callable

Fix: It appeared to be an update issue so , I ran an update on my Anaconda package using conda update anaconda  and that fixed the issue.


Hope it helps someone!

Want more information like this?

Similar Posts

  • Matplotlib Pyplot Plt Python Pandas Data Visualization Plotting

      This is some quick notes about graphing or plotting graphs with Matplotlib in Python. Credits to sentdex.  You can check him out on Youtube.

      In [4]:

      In [10]:

      In [14]:

      In [20]:

      In [23]:

      In [30]:

      Out[30]:

    In [48]:

        Want more information like this?

  • Basic Plotting Using Bokeh Python Pandas Library – Scatter, Line Visualizations

      Bokeh is a powerful framework for data visualization in Python. Here I take a look at straightforward plotting and visualization using this powerful library. Credit to PythonHow. You can check him out on Youtube bokeh.models #It is a low level interface which involves a lot of work bokeh.plotting # It is a middle level interface bokeh.chart #…

  • Python Pandas Pivot Table Index location Percentage calculation on Two columns

    pivot table for year on year This is a quick example of how to use pivot_table,  to calculate year on year percentage sales . In [162]:

      In [163]:


    In [164]:

      Out[164]: First Name Last Name Sex Phone Fax Email Address Booking Date Departure Date Arrival Date Address1 … Number of Passengers…

  • | |

    Test a Logistic Regression Model – Data Analysis and Intrepretation

    OVERVIEW My research work deals with Ghana, a country from the Gapminder dataset.     What I found in my logistic regression analysis. Discussion of the results for the associations between all of my explanatory variables and my response variable   The primary quantitative explanatory variable in my regression analysis is the Income Per Person…

  • | | |

    Deploy Productionalise Azure Machine Learning Algorithm Using Python

    This is a script to consume Azure Machine Learning Model which you build using Azure ML Studio. So basically this is a Request-Response Service (RRS)  according to Microsoft. This was a Boosted Decision Tree Algorithm build with Census Adult Data which is available as one of the Sample DataSet in Azure ML. You can adapt the…

One Comment

Leave a Reply

Your email address will not be published. Required fields are marked *