Declare Public Protected and Private Variables in Python – Object Oriented Programming
In Python, the scope ( Public, Protected, Private) characteristic of an attribute or member of the class is indicated by…
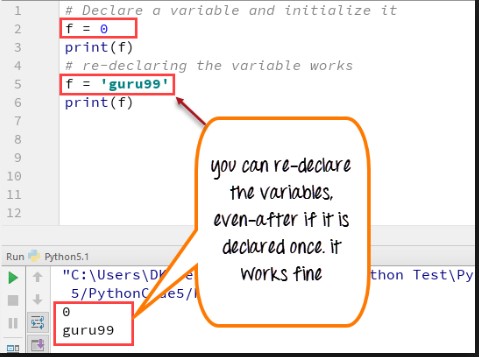
In Python, the scope ( Public, Protected, Private) characteristic of an attribute or member of the class is indicated by…
Sometimes, you might need some packages which do not come with the standard Python libraries and you would want to…
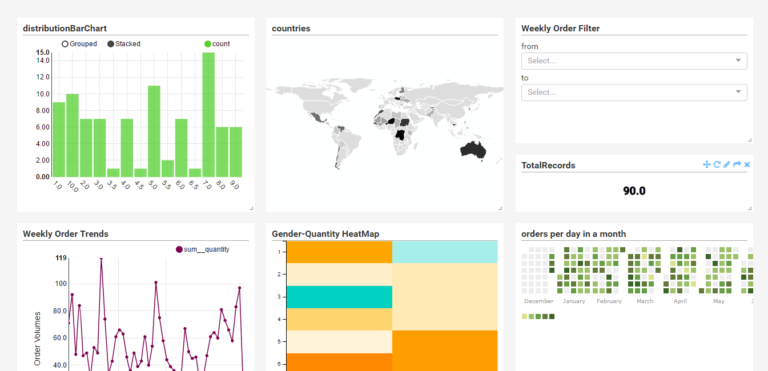
Superset (formerly called Caravel ) BI Tool by http://airbnb.io/superset is a free Data Visualization tool which you can harness its…
This is a quick to create a dictionary object , write it to a JSON file and then read back…
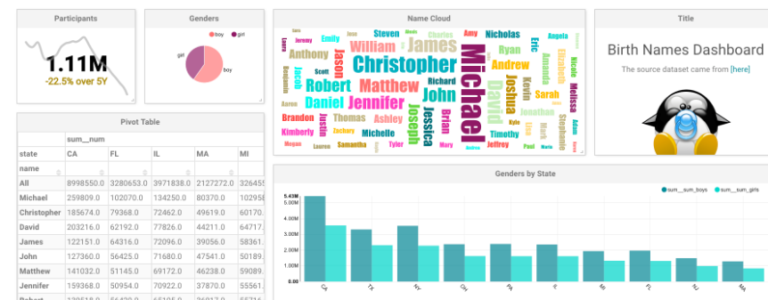
There are a couple Free Open Source Data Visualization Tools and Services which you can make use of for your…
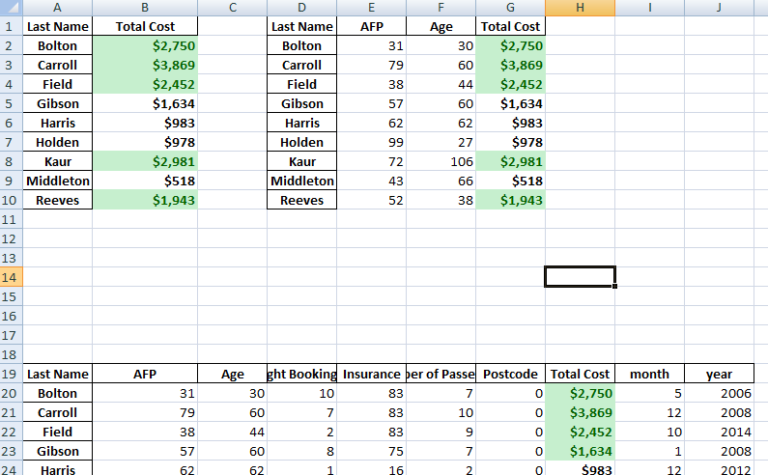
This is a just a bit of addition to a previous post, by formatting the Excel output further using the…
pivot table for year on year This is a quick example of how to use pivot_table, to calculate year on…
This is just some quick scrap notes on the basics of Python GUI building using PyQt. In [1]:
|
1 2 3 4 5 6 7 8 9 10 11 12 13 14 15 16 17 18 19 20 21 22 23 24 25 26 27 28 29 30 31 32 33 34 35 36 37 38 39 40 41 42 43 44 45 46 |
import sys from PyQt4 import QtGui, QtCore # to help add buttons #app = QtGui.QApplication(sys.argv) # #window = QtGui.QWidget() # ##set the posstion and size of the window #window.setGeometry(50, 50, 500, 500) # ##lets set the title #window.setWindowTitle('Date Incrementor') #window.show() class Window(QtGui.QMainWindow): def __init__(self): super(Window, self).__init__() self.setGeometry(50,50, 500, 500) self.setWindowTitle("Date incrementor") # self.setWindowIcon(QtGui.QIcon('logo.png')) #self.show() self.home() def home(self): #create and name a button btn = QtGui.QPushButton("Quit", self) #define what we will do when the button is clicked #btn.clicked.connect(QtCore.QCoreApplication.instance().quit) btn.clicked.connect(self.closeapplication) #lets resisze the button btn.resize(100,100) #lets position the button btn.move(100,100) #lets show the button self.show() #lets create custom methods def closeapplication(self): print('Application closed') sys.exit() |
|
1 |
. |
…
Bokeh is a powerful framework for data visualization in Python. Here I take a look at straightforward plotting and…
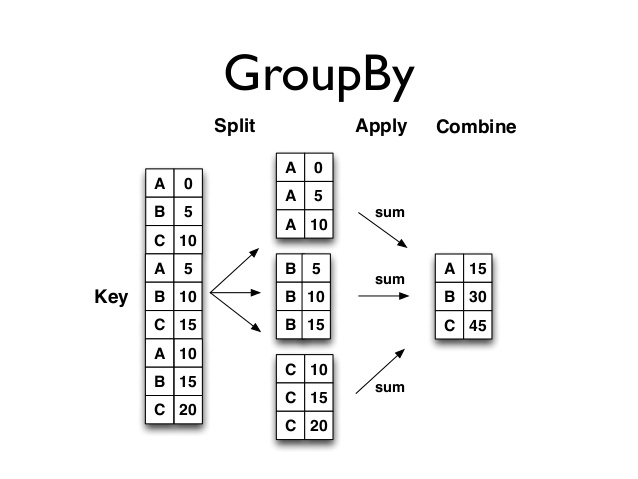
Group By FunctionThis is a quick look at Python groupby function. Very powerful and useful function. We will take a…
An experienced DevOps and Cloud Training Company to meet your DevOps and Cloud needs
You can see how this popup was set up in our step-by-step guide: https://wppopupmaker.com/guides/auto-opening-announcement-popups/
On this website we use first or third-party tools that store small files (cookie) on your device. Cookies are normally used to allow the site to run properly (technical cookies), to generate navigation usage reports (statistics cookies) and to suitable advertise our services/products (profiling cookies). We can directly use technical cookies, but you have the right to choose whether or not to enable statistical and profiling cookies. Enabling these cookies, you help us to offer you a better experience.