pandas

  • | |

    Python Pandas Pivot Table Index location Percentage calculation on Two columns – XlsxWriter pt2

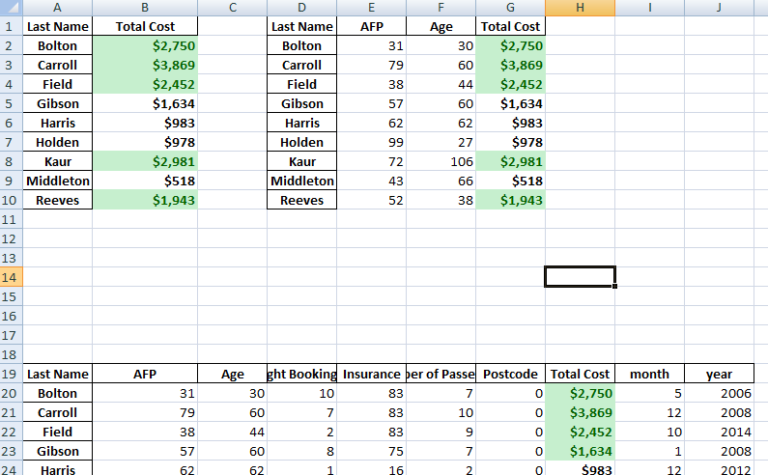
    This is a just a bit of addition to a previous post, by formatting the Excel output further using the Python XlsxWriter package. The additions are : Colour formatting has been added to the Total Cost column The “Total Cost” has been given a money formatting The above uses row : column numeric values instead…

  • |

    Save Python Pivot Table in Excel Sheets ExcelWriter

    Untitled This is a quick script on how to save Python pivot_table in an excel file. Credit to  pbpython In [1]:

      In [2]:


    In [8]:

      Out[8]: First Name Last Name Sex Phone Fax Email Address Booking Date Departure Date Arrival Date Address1 … Number of Passengers Total Cost Currency Numeric Code…

  • Python Pandas Pivot Table Index location Percentage calculation on Two columns

    pivot table for year on year This is a quick example of how to use pivot_table,  to calculate year on year percentage sales . In [162]:

      In [163]:


    In [164]:

      Out[164]: First Name Last Name Sex Phone Fax Email Address Booking Date Departure Date Arrival Date Address1 … Number of Passengers…

  • Python Bokeh plotting Data Exploration Visualization And Pivot Tables Analysis

    This is a quick walk through Bokeh data exploration and visualization and also python pivot_tables (credit to pbpython on the pivot_tables).Visualization Dashboard In [49]:

      In [50]:


    In [51]:

      Out[51]: First Name Last Name Sex Phone Fax Email Address Booking Date Departure Date Arrival Date Address1 … Number of Passengers Total Cost Currency…

  • Python Pandas Groupby function agg Series GroupbyObject

    Group By FunctionThis is a quick look at Python groupby function. Very powerful and useful function. We will take a simple look at it here. Credits to Data School , creator of Python course materials. lets import sample dataset In [18]:

      In [19]:

      In [20]:

      Out[20]: country beer_servings spirit_servings wine_servings total_litres_of_pure_alcohol continent…

  • |

    Python iloc, loc, ix Data Retrieving Selection Functions

      Pandas iloc, loc, and ix functions are very powerful ways to quickly select data from your dataframe. Today , we take a quick look at these 3 functions. Credits to Data School, you can check him out in Youtube  In [1]:

      In [2]:

      In [3]:

      Out[3]: City Colors Reported Shape Reported State…

  • Aggregation – Pandas Numpy Python Series DataFrame

      In this quick notes, we will go through aggregation in Python. This is part of lectures on Learning Python for Data Analysis and Visualization by Jose Portilla on Udemy.

      url = “http://archive.ics.uci.edu/ml/machine-learning-databases/wine-quality/” In [2]:

      In [4]:

      Out[4]: fixed acidity volatile acidity citric acid residual sugar chlorides free sulfur dioxide total sulfur dioxide density…

  • |

    Rank Sort Series DataFrames in Python Pandas Numpy

      In this quick notes, we will have a look at Rank and Sort in Series and DataFrames in Python In [1]:

      In [3]:

      Out[3]:

    In [4]:

      Out[4]:

    In [5]:


    Out[5]:

    In [6]:

      Out[6]:

    In [7]:

      In [8]:

      Out[8]:

    In [10]:

     …

  • |

    Pandas DataFrame and Series Alignment Python Notes

    This week we have a look at Data Alignment in Python In [1]:

      In [2]:

      Out[2]:

    In [3]:

      Out[3]:

    In [4]:

      Out[4]:

    In [6]:

      Out[6]: A B LA 0 1 GA 2 3 In [10]:

      Out[10]: A B C LA 0 1 2 NYC 3 4…