Run Explore Frequency Distribution of Your Dataset in SAS Studio
SAS Studio is a very powerful statistical program which are used by many corporations for various analytic and data science tasks.
We briefly want to look at how we can check sum frequency statistics on some columns / attributes in our data.
- lets set the library name for our working directory where our dataset is located and make it read only so we do not make changes to the actual dataset
|
1 |
LIBNAME mydata "/courses/d1406ae5ba27fe300" access=readonly; |
2. lets define the dataset we will be working with
|
1 |
DATA new; set mydata.nesarc_pds; |
3. Lets give our attributes /columns of interest understandable descriptions
|
1 2 3 4 5 |
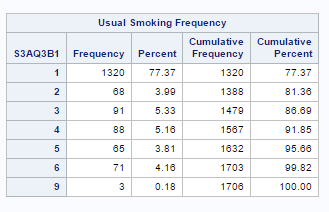
LABEL TAB12MDX ="Tobacco Dependence Past 12 months" CHECK321 = "Smoked Cigarettes in Past 12 months" S3AQ3B1 = "Usual Smoking Frequency" S3AQ3C1 = "Usual Smoking Quantity" AGE= "AGE"; |
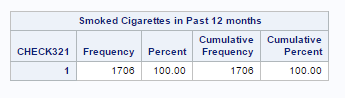
4. Lets subset only last 12 months past smokers with ages less than or equal to 25
|
1 2 3 |
IF CHECK321 = 1; IF AGE LE 25; |
5. Let’s start a procedure to sort our data by the unique attribute/column IDNUM
|
1 |
PROC SORT; by IDNUM; |
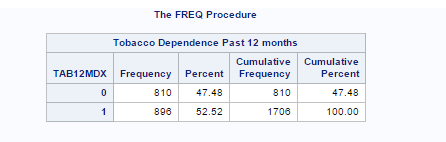
6. Lets start a procedure to get the frequency distribution of the attributes or variables we are interested in
|
1 2 |
PROC FREQ; TABLES TAB12MDX CHECK321 S3AQ3B1 S3AQ3C1 AGE; RUN; |
7. Now lets run the program by hitting the run button 
8. Lets check to see if our program ran with any errors or warnings so we can rectify it. 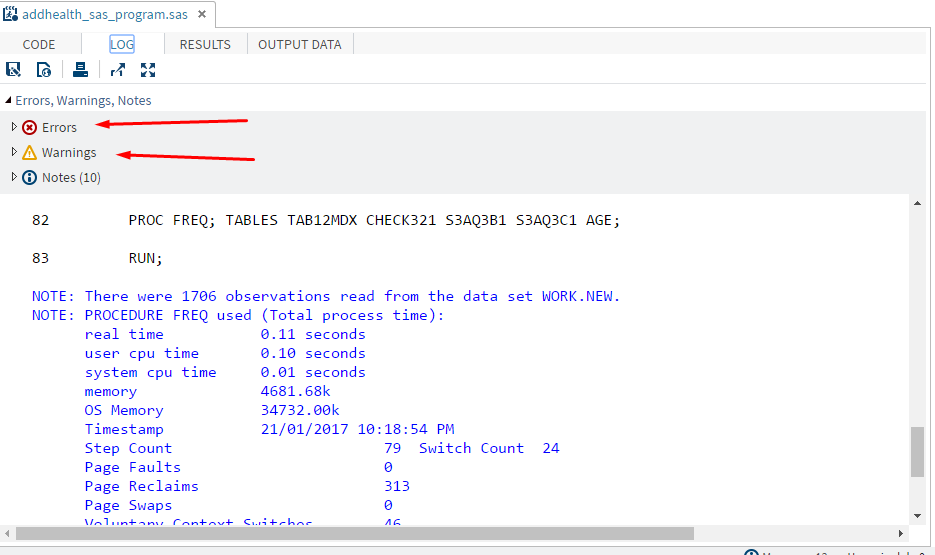
8. There are no errors so let us check our results
Note: Some common logical operators you might use in your SAS conditional / logical statements can be seen in this image.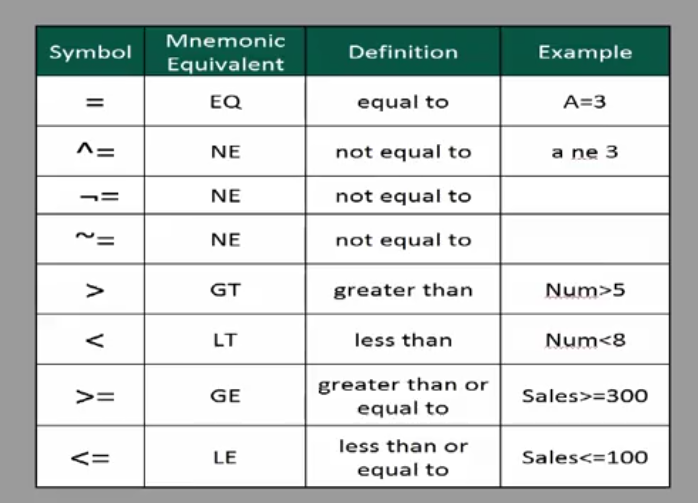
Summary:
What you learnt.
- You learned the statement to set your dataset library and set the dataset you will be working with
- You learnt a statement to give descriptive names to your variables of interest
- We learnt a simple if statement to select a section of your dataset
- You saw how to sort your dataset and finally run a frequency distribution with the PROC statements
This is quite fundamental but it gives you a quick idea of how SAS Studio works.
References:
Data Management and Visualization : Coursera