Quick Graphs On Normal Distribution, Skewness, Mean ,Mode, Median And Central Limit Theorem
These are quick reference charts about basic Statistics of your data.

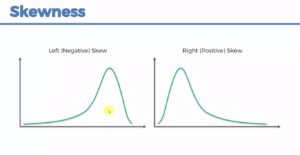
Skewness of the Data is described by the tail of the data.
Left skewed means the tail points to the left and Right Skewed means the tail points to the right
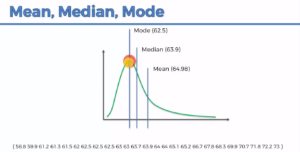
The Skewness and the position of the Mean and Median
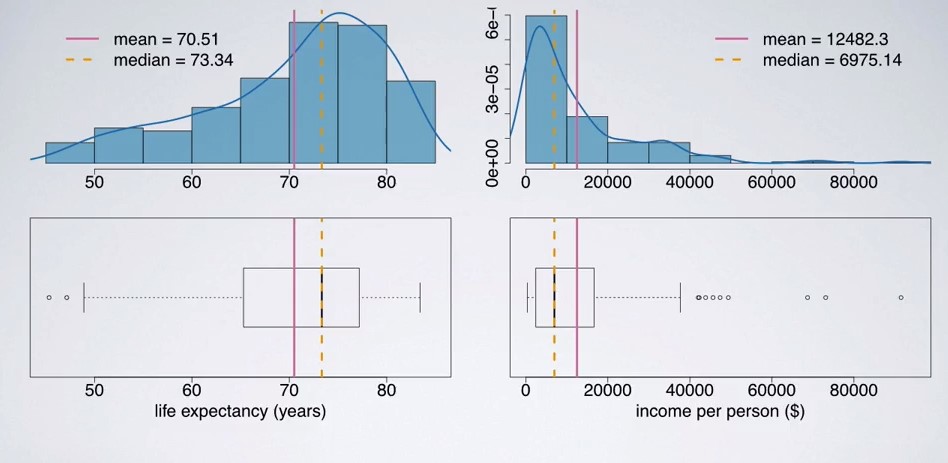
The second graph below indicates that in the
- Left Skewed distribution, the Mean is less than (<) the Median
- Right Skewed distribution, the Mean is greater than (>) the Median
- Symmetry, the Mean is approximately same as the Median

Robust Statistic:
The Median and Interquartile range (IQR) are generally a good representation of the center and spread respectively of skewed distributions than the Mean and Standard Deviation or Range. This is because the Median and Interquartile range values are not generally affected by the outliers or by extreme minimum and maximum values

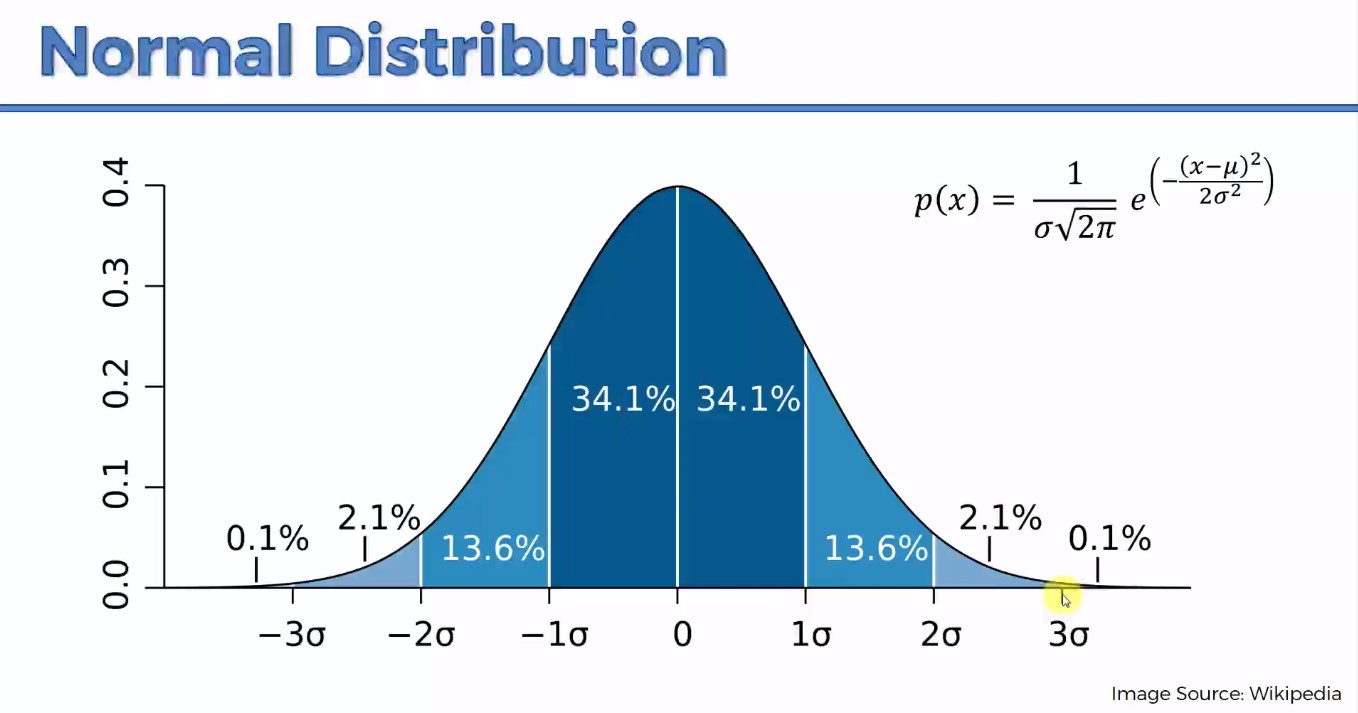
The Central Limit Theorem (CLT)
According to the Central Limit Theorem (CLT), the distribution of sample statistics is nearly normal, centered at the population mean, and with a standard deviation equal to the population standard deviation divided by square root of the sample size.

Hence, for Central Limit theorem, when you take the means of the sampling distribution you will eventually end up having a normal distribution.
Conditions for the CLT:
- Independence: Sampled observations must be independent
- Sampled observations must be a random sample / assignment
- if sampling without replacement, the sample size (n) should be less than 10% of the population
- Sample size / Skew: The second condition is that either the population distribution is normal or skewed, the sample size must be large. The rule of thumb is that the sample size (n) is greater than 30
This can be visualised using this tool here
Or you can use this tool here : CLT_mean ( Credit: Duke University)
Other relevant apps for checking other stats can also be found here: stats apps
Credit to Duke University on Coursera and Statistics for Business Analytics A-Z on Udemy