Coursera
datapandasadmin

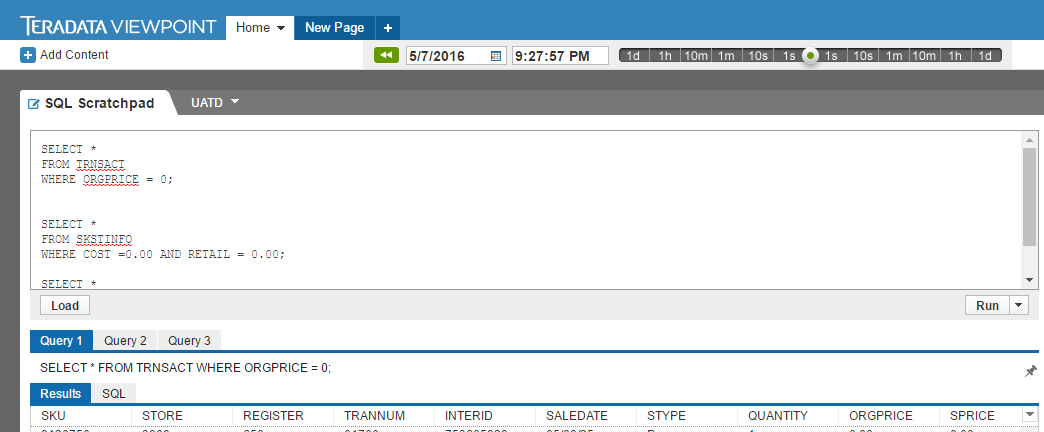
Run Explore Frequency Distribution of Your Dataset in SAS Studio

SAS Studio is a very powerful statistical program which are used by many corporations for various analytic and data science tasks. We briefly want to look at how we can check sum frequency statistics on some columns / attributes in our data. lets set the library name for our working directory where our dataset is

Read More »
Coursera
datapandasadmin

Teradata Viewpoint – SQL Scratchpad – Writing Queries Dillard’s Department Store Database

Analysing ‘Big Data’ from a database with real world data requires retrieving data from the database by writing relevant queries. As part of “Managing Big Data with MySQL” by Duke University on Cousera, I dealt with real world data that comprise hundreds to millions of entries/rows. This is the database of Dillard’s Department stores, specifically, the UA_DILLARDS that contains

Read More »
Coursera
datapandasadmin

Coursera Capstone Project – Data Analysis and Interpretation

What is it This week, I started the Data Analysis and Interpretation Capstone by Wesleyan University on Coursera. This is the final of 5 course specialisation. The capstone project is expected to take 4 weeks. With each week tackling and doing a major component of the Project work.   What is the objective The objective of

Read More »

Running a Random Forest – Data Analysis and Intrepretation

Overview My research work deals with Ghana, a country from the Gapminder dataset as has already been discussed from the beginning and progression through this course. The variables in my observation dataset are all quantitative. For the purposes of this assignment, I have binned my quantitative target variable, Life Expectancy (lifeexpectancy) into a 2-level binary categorical target variable. I have named

Read More »

Writing About The Data – Data Analysis and Intrepretation

OVERVIEW My research work deals with Ghana, a country from the Gapminder dataset and there are 5 main variables I have been working with so I will be looking at the sample, procedure and measures for these 5 variables. The variables are: i.      Incomeperperson (Income Per Person) ii.    literacyrate (Literacy  Rate) iii.   lifeexpectancy  (Life

Read More »

Machine Learning – Coursera

So today, I got my results from the Machine Learning course on Coursera.org. It was a month of intense digging into the fundamentals and core aspects of machine learning. No wonder machine learning is most talked about online. The module is ideal for beginners who want to get hands on experience with Machine Learning. It

Read More »

K-Means Cluster Analysis – Data Analysis and Intrepretation

Overview My research work deals with Ghana, a country from the Gapminder dataset as has already been discussed from the beginning and progression through this course I conducted a k-means cluster analysis to find out the underlying sets of the population of Ghana based on their similarity of responses on 22 variables that represent characteristics

Read More »