Generating a Correlation Coefficient – Data Analysis and Intrepretation
Chosen Dataset
I will be working with Data from the Gapminder dataset.
This happens to be the same dataset I worked with under
the Data Management and Visualization course assignments. As elaborated and discussed in under the Data Management and Visualization course assignments, I have chosen to focus on the country, Ghana.
Hence I will be particularly interested in some data about the country Ghana (as dealt with under Data Management and Visualization course
assignments) and these are primarily the
a. incomeperperson
b. lifeexpectancy
It is worth pointing out that, the gapminder.csv provided for the assignment
comprise all the countries in the world without a laser focus on my country of
interest –Ghana. This means that only one year of value for each of these core
variables are entered in the gapminder.csv data provided for the assigment.
The result is that when I run my python program with just these single values there are no other more yearly based values for each of these various to make a
meaningful frequency distribution which are only specific to Ghana, unless I
compare the values of Ghana in general to all the other countries, which is NOT
the focus of my research work.
To be able to achieve this laser focus research on only the country Ghana I will
fetch this data from the http://www.gapminder.org/ website, specifically their data section which can be found herehttp://www.gapminder.org/data/.
I will therefore need to compile a new data csv file with focus on Ghana which will give me all the variables I will need for my analysis. In a nutshell, this new
data csv file seeks to enable me load and call the relevant variables and
columns in my python program and more importantly to be get the relevant
variables I will need for my research work going forward.
I will, therefore, call the new data csv file for the assignment: gapminder_ghana_updated.csv
This will be the Gapminder csv data file I will be calling and loading into my
python program
The gapminder_ghana_updated.csv dataset csv for this project can be viewed and dowloaded here:
https://drive.google.com/file/d/0B2KfPRxy4ootQnRzVUZQQXdFX1U/view?usp=sharing
see screenshot here for guide (http://prntscr.com/9gctxn)
Data Variables
All the data variables I worked with on the Gapminder dataset are all quantitative so they are ideal for Generating a Pearson Correlation
Coefficient and for that matter ideal for the Pearson Correlation Test Assignment
The Research Question
For the purposes of this assignment; Generating a Pearson
Correlation Coefficient, I will modify my research question used in the
previous course a little bit.
Hence the question I will be looking at in this assignment is: Is there an association OR relation between Income Per Person and Life Expectancy of the people of Ghana
Hypothesis Testing
The Null and Alternate Hypotheses:
From the above research question, the Null Hypothesis (Ho)
is that there is no association /relations between Income Per Person and Life
Expectancy of the people of Ghana.
Whereas the Alternate Hypothesis (Ha) states that there is an association / relation between Income Per Person and Life Expectancy of the people of Ghana.
Sample:
Sample is the data from the Gapminder dataset with focus on Ghana
Assessing the evidence:
This is done by Running Pearson Correlation test on the hypotheses.
I run this test by using the Python program.
MY PYTHON PROGRAM CODE:
|
1 2 3 4 5 6 7 8 9 10 11 12 13 14 15 16 17 18 19 20 21 22 23 24 25 26 27 28 29 30 31 32 33 34 35 36 37 38 39 40 41 42 43 44 45 46 47 48 49 50 51 52 53 54 55 56 57 58 59 60 61 62 63 64 65 66 67 68 69 70 71 72 73 74 75 76 77 78 79 80 81 82 83 84 85 86 87 88 89 90 91 92 93 94 95 96 97 98 99 100 101 102 103 104 105 106 107 |
# -*- coding: utf-8 -*- """ Created on Sat Jan 16 01:36:49 2016 @author: Bernard """ import pandas import numpy import seaborn import scipy import matplotlib.pyplot as plt data = pandas.read_csv('gapminder_ghana_updated.csv', low_memory=False) #setting variables you will be working with to numeric data['incomeperperson'] = data['incomeperperson'].convert_objects(convert_numeric=True) data["lifeexpectancy"] = data["lifeexpectancy"].convert_objects(convert_numeric=True) #replacing missen values with Nan data['incomeperperson']=data['incomeperperson'].replace('', numpy.nan) data['lifeexpectancy']=data['lifeexpectancy'].replace('', numpy.nan) scat1 = seaborn.regplot(x="incomeperperson", y="lifeexpectancy", fit_reg=True, data=data) plt.xlabel('incomeperperson') plt.ylabel('lifeexpectancy') plt.title('Scatterplot for the Association Between incomeperperson and lifeexpectancy of Ghana') print ('') print ('') print ('') print ('association between incomeperperson and lifeexpectancy of Ghana') print (scipy.stats.pearsonr(data['incomeperperson'], data['lifeexpectancy'])) print ('') print ('') print ('') |
CODE OUTPUT:
<<<<<<<<<<<<<CODE OUTPUT BEGIN>>>>>>>>>>>>>>>>>>>
association between incomeperperson and lifeexpectancy of
Ghana
(0.84735157770557723, 9.6218092417241115e-61)

<<<<<<<<<<<<<CODE OUTPUT ENDED>>>>>>>>>>>>>>>>>>>
DRAWING CONCLUSION (SUMMARY):
From the output of the code, it can be seen that the p-value = 9.6218092417241115e-61
and it is far less than the statistically and scientifically testing value of
0.05 (or 5%). And the Pearson Correlation Coefficient, r = 0.84743.
The p-value indicates that the test is significant. This
means that we have enough evidence against the Null Hypothesis (Ho) and can
therefore reject the Null Hypothesis (Ho).
In other words, there is a relation or association between Income Per Person and Life Expectancy of the people of Ghana. And this is a strong positive relationship
because the value 0.84743 is closer to positive one (+1)
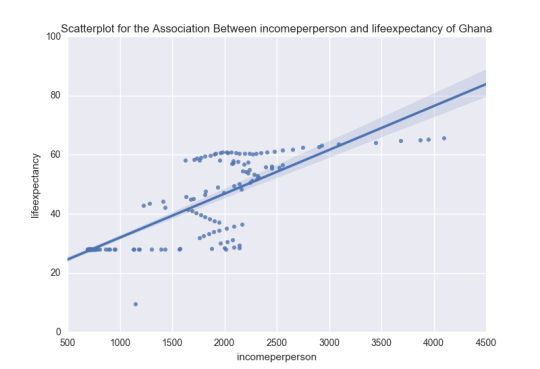
This is further demonstrated by the Scatterplot. From the Scatterplot, an increase in the incomeperperson is associated with an increase in the lifeexpectancy of the people of Ghana. This is a demonstrated by a positive linear line which moves
positively upwards.
Hence there is a strong positive relationship between Income Per Person and Life Expectancy of the people of Ghana.
Also from the outputs, it means the positive relations between Income Per Person and Life Expectancy of the people of Ghana could not have happened by mere chance
Furthermore, from the output of the test, it means when we take the Pearson Correlation Coefficient, (r) value of 0.84743 and square it, we can predict what
percentage of variability there is in the Life Expectancy of the people of Ghana.
Hence mathematically,
r = 0.84743
r2 = (0.84743)2
= 0.718
The value 0.718 means that if we know the Pearson Correlation Coefficient, (r) value of the incomeperperson of the people of Ghana, we can predict 71.8%
of the variability we see in the lifeexpectancy of the people of Ghana


