
Connect Push Commit Pull Your GitHub Repository To Your Local Computer’s Directory
Introduction Github is a web version control system which is very useful when you are working on various projects or
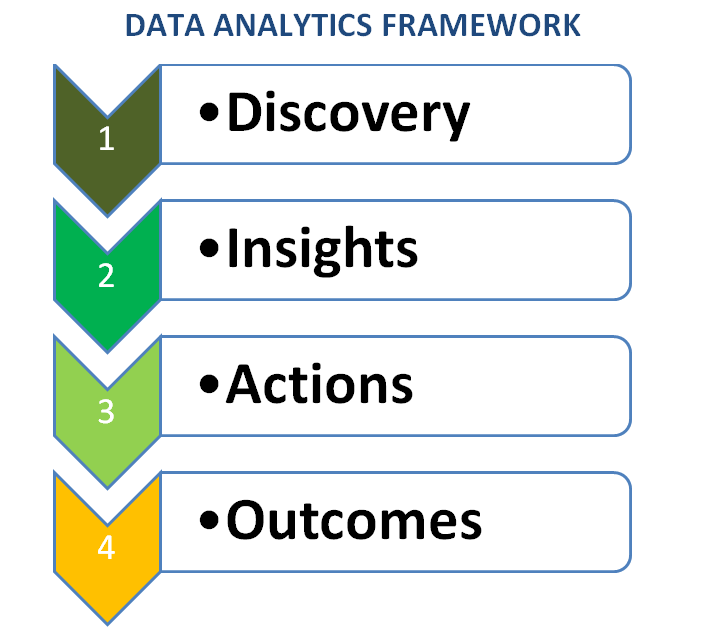
Data Analytics Framework – Simple Short Notes For Aspiring Data Analysts
In the process of Data Analysis, sometimes, we are too engrossed and happy about the available data and try to
Google Data Studio is Free For Everyone: Take Your Analytics To The Next Level
On February 2, 2017, Nick Mihailovski, Product Manager, Google Data Studio announced that Google Data Studio is now free for everyone. That the
Python Similarities Comparison With Java – Short Code Snippets
Trying to learn new language when you already know another one is most at times easier to do. And it
How To Use ER Assistant – FREE Entity Relationship Diagram (ERD) Creation Tool
There are a lot of ER Diagram Tools. However, by far, one of the favourite ones I use is the
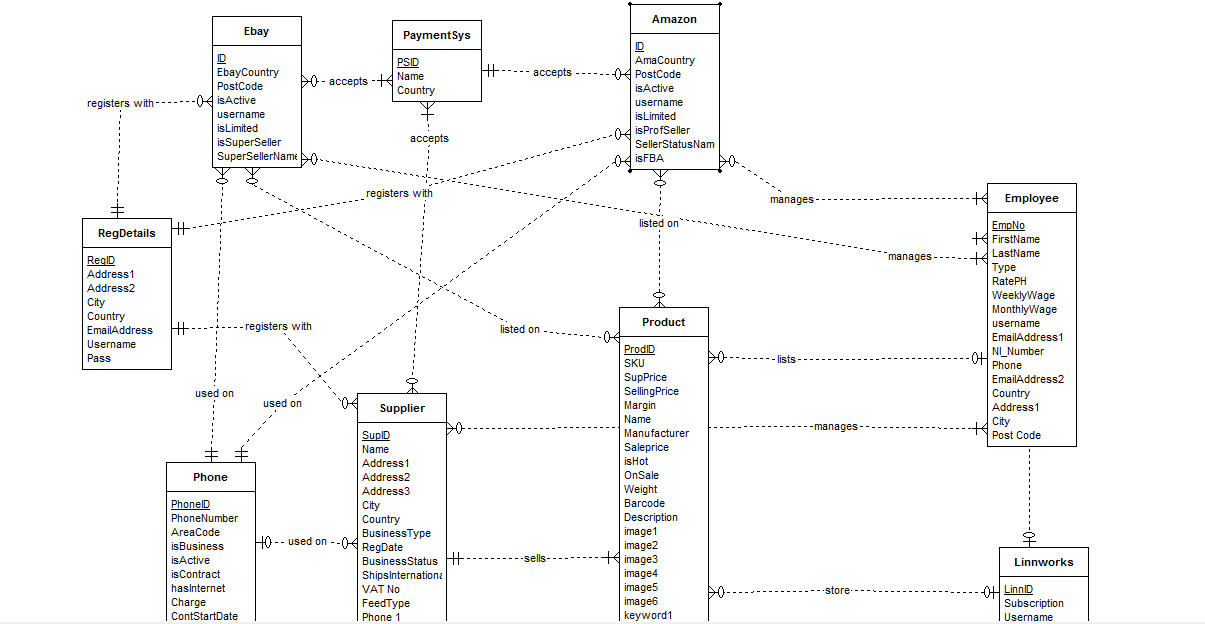
Drop Shipping Ecommerce Database ER Diagram and Conceptual Modeling
In this short article, we look at a sample ERD Diagram which is designed using ER-Assistant software (usage of this
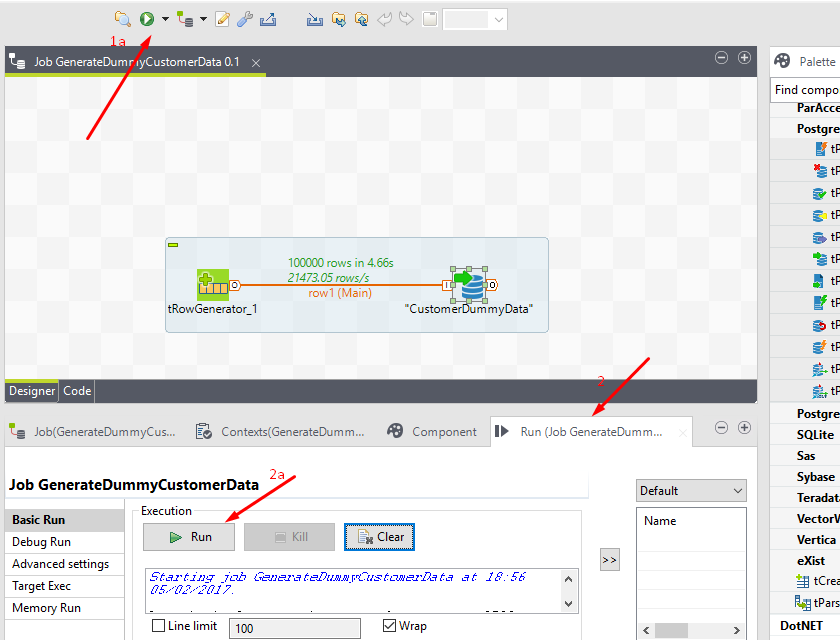
Generating Dummy Data In Talend For Testing and Development And Inserting Into PostgreSQL
Handling customer data is very key and sometimes, you do not want to use your real customer’s data and information
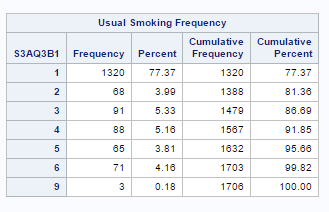
Run Explore Frequency Distribution of Your Dataset in SAS Studio
SAS Studio is a very powerful statistical program which are used by many corporations for various analytic and data science
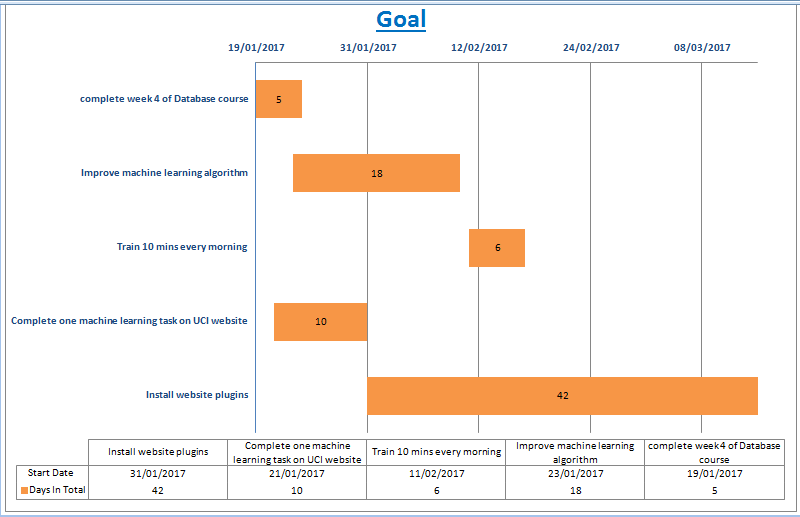
Creating a Gantt Chart Graph In Excel
Let’s assume we have some simple goals we want to achieve. Lets set our goals as follows: We enter our
DataPandas LTS
An experienced DevOps and Cloud Training Company to meet your DevOps and Cloud needs

