Simple Interactive Google Data Studio Dashboard
Google has now made Data Studio accessible and you can use it to create pretty cool data visualizations. You can…
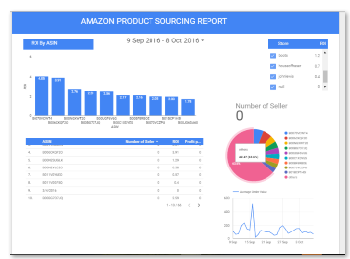
Google has now made Data Studio accessible and you can use it to create pretty cool data visualizations. You can…
This tutorial is just to illustrate how to save Python Pandas dataframe into one excel work SHEET . You…
Untitled This is a quick script on how to save Python pivot_table in an excel file. Credit to pbpython In [1]:…
pivot table for year on year This is a quick example of how to use pivot_table, to calculate year on…
This is a quick walk through Bokeh data exploration and visualization and also python pivot_tables (credit to pbpython on the pivot_tables).Visualization…
Sometimes you want to get some numbers and also percentages for quick analysis. This is a quick simple way to…
This is just some quick scrap notes on the basics of Python GUI building using PyQt. In [1]:
|
1 2 3 4 5 6 7 8 9 10 11 12 13 14 15 16 17 18 19 20 21 22 23 24 25 26 27 28 29 30 31 32 33 34 35 36 37 38 39 40 41 42 43 44 45 46 |
import sys from PyQt4 import QtGui, QtCore # to help add buttons #app = QtGui.QApplication(sys.argv) # #window = QtGui.QWidget() # ##set the posstion and size of the window #window.setGeometry(50, 50, 500, 500) # ##lets set the title #window.setWindowTitle('Date Incrementor') #window.show() class Window(QtGui.QMainWindow): def __init__(self): super(Window, self).__init__() self.setGeometry(50,50, 500, 500) self.setWindowTitle("Date incrementor") # self.setWindowIcon(QtGui.QIcon('logo.png')) #self.show() self.home() def home(self): #create and name a button btn = QtGui.QPushButton("Quit", self) #define what we will do when the button is clicked #btn.clicked.connect(QtCore.QCoreApplication.instance().quit) btn.clicked.connect(self.closeapplication) #lets resisze the button btn.resize(100,100) #lets position the button btn.move(100,100) #lets show the button self.show() #lets create custom methods def closeapplication(self): print('Application closed') sys.exit() |
|
1 |
. |
…
Bokeh is a powerful framework for data visualization in Python. Here I take a look at straightforward plotting and…
The key advice for any Data Analysis project is to never start any analysis without first having a structured plan….
This is a short scrap notes from the Machine Learning Course taught by Associate Professor, Andrew Ng, Stanford University…
An experienced DevOps and Cloud Training Company to meet your DevOps and Cloud needs
You can see how this popup was set up in our step-by-step guide: https://wppopupmaker.com/guides/auto-opening-announcement-popups/
On this website we use first or third-party tools that store small files (cookie) on your device. Cookies are normally used to allow the site to run properly (technical cookies), to generate navigation usage reports (statistics cookies) and to suitable advertise our services/products (profiling cookies). We can directly use technical cookies, but you have the right to choose whether or not to enable statistical and profiling cookies. Enabling these cookies, you help us to offer you a better experience.