Various Types of Basic Charts For Data Analysis and Exploration – Visualization and Meaning
Sometimes, you need some charts to explore your data and many times when your analysis is done and you want…
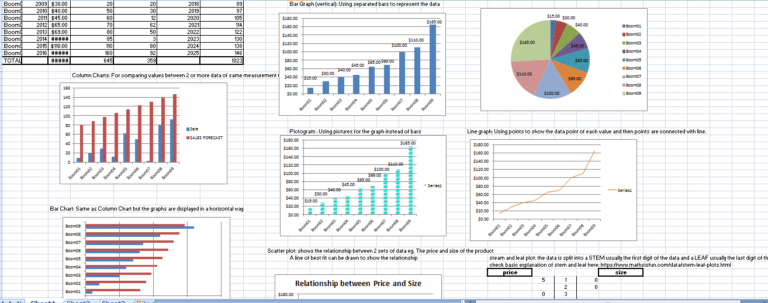
Sometimes, you need some charts to explore your data and many times when your analysis is done and you want…
When you run a query , for example, in SQL and you copy and paste the result in Excel, and…
This is a quick code to create a BUTTON , CHECKBOX and COMBO BOX and assign some action to them…
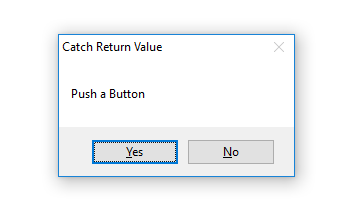
Adding actions to messages boxes Message Boxes, like most functions, return one of these values and their respective meanings Button…
Autoit is a very simple yet powerful tool to automate simple scripts. Today, we are looking at LOOPS. Credit to 403forbidden403….
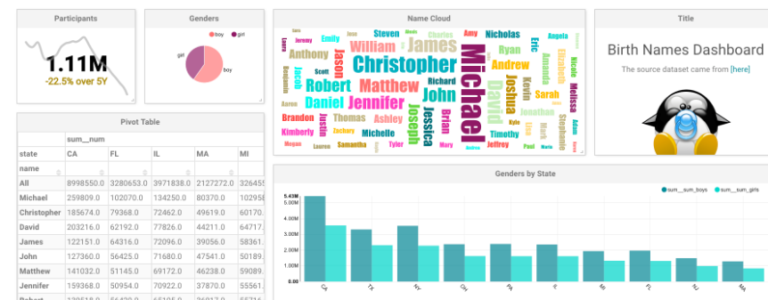
There are a couple Free Open Source Data Visualization Tools and Services which you can make use of for your…
This is a simple guide to create and assign a “button” to your simple VBA code. Credit to WiseOwlTutorials. You can…
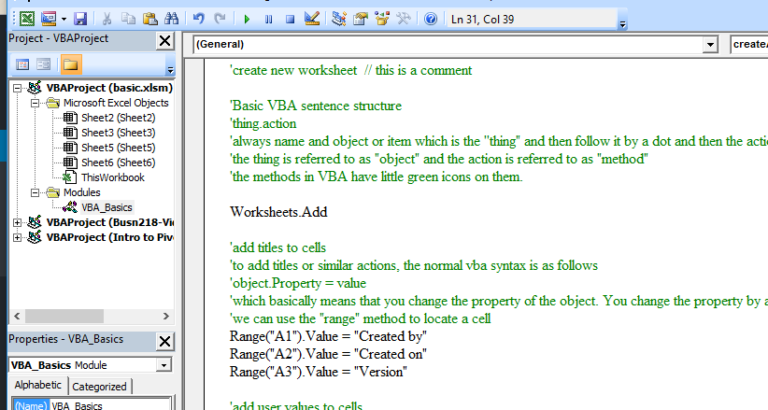
This is a quick and simple VBA code with some comments about the structure and how it the basic syntax…
For a refresher tutorial or quick look up on INDEX and MATCH Functions in Excel, ExcelIsFun on Youtube explains it very clearly with great…
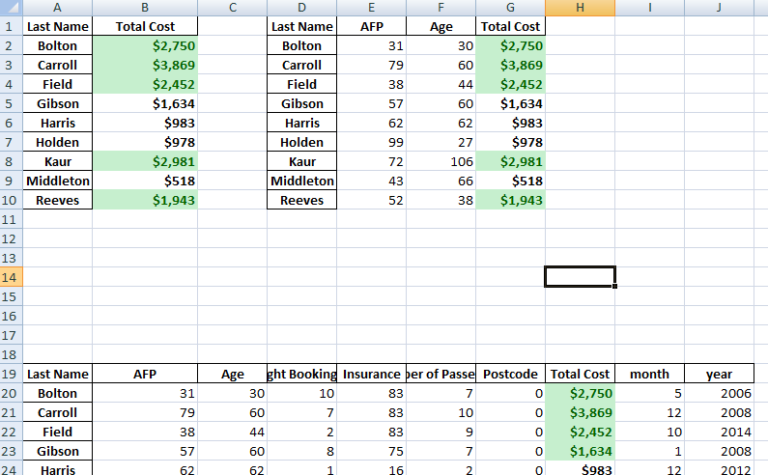
This is a just a bit of addition to a previous post, by formatting the Excel output further using the…
An experienced DevOps and Cloud Training Company to meet your DevOps and Cloud needs
You can see how this popup was set up in our step-by-step guide: https://wppopupmaker.com/guides/auto-opening-announcement-popups/
On this website we use first or third-party tools that store small files (cookie) on your device. Cookies are normally used to allow the site to run properly (technical cookies), to generate navigation usage reports (statistics cookies) and to suitable advertise our services/products (profiling cookies). We can directly use technical cookies, but you have the right to choose whether or not to enable statistical and profiling cookies. Enabling these cookies, you help us to offer you a better experience.