R Shiny App for Mining Fields Evaluation
Presenting your report in an interactive and user-friendly way is a very effective communicative tool which can help you convey message to your audience easily.
R is a very powerful analytic tool which helps you to do that with the “shiny” package.
Here, I simply look at an app about the Mining Fields Evaluation which was part of a lesson I went through.
The structure of the code is briefly outlined below.
The final shiny app and the associated csv file for the app can all be access here: Mining Field Evaluation Shiny App
Firstly, we import the needed libraries.
Secondly, we define the 3 main components of our shiny app we need, which are :
a. the server component,
b. the user interface component
c. the shiny app component
Thirdly, we build our various components. I will not be going into the very details of building the various sections. However, the entire code can be found below:
|
1 2 3 4 5 6 7 8 9 10 11 12 13 14 15 16 17 18 19 20 21 22 23 24 25 26 27 28 29 30 31 32 33 34 35 36 37 38 39 40 41 42 43 44 45 46 47 48 49 50 51 52 53 54 55 56 57 58 59 60 61 62 63 64 65 66 67 68 69 70 71 72 73 74 75 76 77 78 79 80 81 82 83 84 85 86 87 88 89 90 91 92 93 94 95 96 97 98 99 100 101 102 103 104 105 106 107 108 109 110 111 112 113 114 115 116 117 118 119 120 121 122 123 124 125 126 |
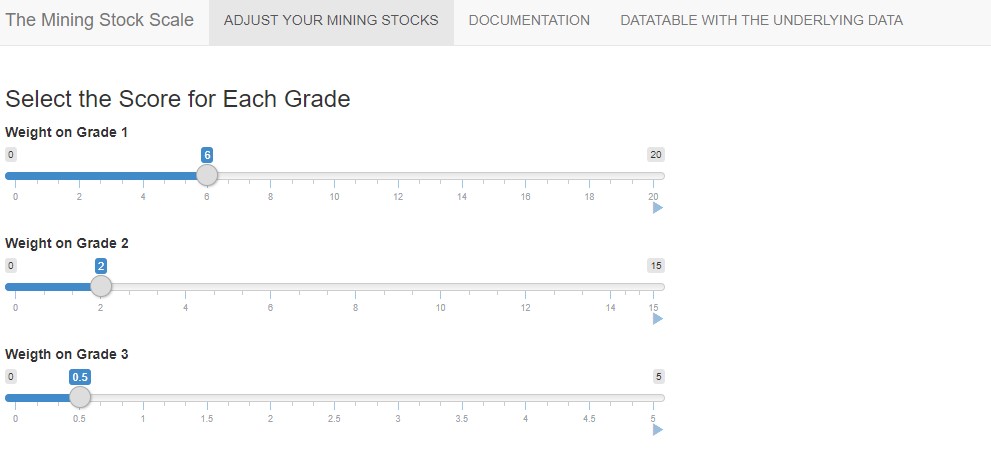
#mining evaluation library(shiny) library(readr) library(DT) library(dplyr) library(ggplot2) library(shinyjs) #server component server <- function(input, output, sessions){ #read in the dataset. df <- read_delim("course_proj_data.csv",delim=";") #replace spaces in column names names(df) <- gsub(" ","_",names(df)) #call the shiny reactive function to respond to user's selections on the plot df_with_score <- reactive({ user_selection <- input$plot_brush if(length(input$plot_brush)>0){ sel = df %>% mutate(Score = (G1* input$grade1) + (G2 * input$grade2)+ (G3 * input$grade3))%>% mutate(ScoreRank = if_else(Score > 100,"High", if_else(Score >= 80 && Score < 100,"Medium","Low"))) sel1 = brushedPoints(sel,user_selection) }else{ df %>% mutate(Score = (G1* input$grade1) + (G2 * input$grade2)+ (G3 * input$grade3))%>% mutate(ScoreRank = if_else(Score > 100,"High", if_else(Score >= 80 && Score < 100,"Medium","Low"))) } }) #call the renderPlot function to send back plot to the user interface component output$plot <- renderPlot({ ggplot(df_with_score())+ aes(x=Score, y=MarketCap_in_M)+ geom_point()+ geom_smooth(method="lm")+ labs(title = "Evaluation of Mining Sites based on Total Grade of Fields", x = "Total Grade of Fields", y= "Market Capital Valuation in Millions") }) #call the DataTable to send back a table with any user selections back to the user interface output$table <- DT:: renderDataTable(DT::datatable(df_with_score())) #call the shinyApp download function handler to download the data customer selected. output$download_data <- downloadHandler( filename = function(){ paste("mining_filed_scores_", Sys.Date(), ".csv",sep = "") }, content = function(file){ write.csv(df_with_score(), file) } ) #send the raw data to the output for user download output$table1 <- DT::renderDataTable(DT::datatable(df)%>% formatCurrency("MarketCap_in_M","£") ) #function to set the raw-data name and downloaded filename output$download_raw_data <- downloadHandler( filename = function(){ paste("mining_field_evaluation_rawdata_",Sys.Date(), ".csv",sep = "") }, content = function(file){ write.csv(df,file) } ) } #user interface component ui <- navbarPage("The Mining Stock Scale", tabPanel("ADJUST YOUR MINING STOCKS", h3("Select the Score for Each Grade"), sliderInput(inputId = "grade1", label = "Weight on Grade 1", value = 6, min =0 , max= 20, animate = TRUE , width = "50%"), sliderInput(inputId = "grade2", label = "Weight on Grade 2", value = 2, min = 0, max = 15, animate = T, width = "50%"), sliderInput(inputId = "grade3", label = "Weigth on Grade 3", value =0.5, min = 0, max =5, step = 0.5,animate = T, width="50%"), br(""), h1("Market Capital Valuation in Millions Chart"), plotOutput("plot", brush = "plot_brush"), br(""), h1("Summary Table") ,DT::dataTableOutput("table"), downloadButton(outputId = "download_data",label = "Download Table Data")), tabPanel("DOCUMENTATION", h3(a(href="http://www.datapandas.com", target="_blank", "Thanks for visiting")) ), tabPanel("DATATABLE WITH THE UNDERLYING DATA", h1("This Is The Raw Data Underlying This Analysis"), br(""), DT::dataTableOutput("table1"), #, downloadButton("download_raw_data",label = "Download the Raw Data") ) ) #shiny component shinyApp(ui= ui, server = server) |
Now when you want to deploy your, you can deploy on it on shinyapp.io.
You will have to create an account with them and you can simply deploy straight from your R-Studio.
Watch this quick video on youtube on a quickway to deploy your shiny app.
Hopefully , this will give you a taste of shiny apps and you can see how useful it will be in your arsenal of tools in your Analytics and Data Science journey.
References:
R Shiny Interactive Web Apps – Next Level Data Visualization – Udemy
Deploy Your ShinyApp – Youtube video