Exploring Statistical Analysis in the Context of Correlation – Testing a Potential Moderator
Exploring Statistical Analysis in the Context of Correlation
Chosen Dataset
I will be working with Data from the Gapminder dataset.
This happens to be the same dataset I worked with under
the Data Management and Visualization course assignments. As elaborated and discussed in under the Data Management and Visualization course assignments, I have chosen to focus on the country, Ghana.
Hence I will be particularly interested in some data about the country Ghana (as dealt with under Data Management and Visualization course
assignments) and these are primarily the
a. incomeperperson
b. lifeexpectancy
c. inflation
It is worth pointing out that, the gapminder.csv provided for the assignment
comprise all the countries in the world without a laser focus on my country of
interest –Ghana. This means that only one year of value for each of these core
variables are entered in the gapminder.csv data provided for the assigment.
The result is that when I run my python program with just these single values there are no other more yearly based values for each of these various to make a
meaningful frequency distribution which are only specific to Ghana, unless I
compare the values of Ghana in general to all the other countries, which is NOT
the focus of my research work.
To be able to achieve this laser focus research on only the country Ghana I will
fetch this data from the http://www.gapminder.org/ website, specifically their data section which can be found herehttp://www.gapminder.org/data/.
I will therefore need to compile a new data csv file with focus on Ghana which will give me all the variables I will need for my analysis. In a nutshell, this new
data csv file seeks to enable me load and call the relevant variables and
columns in my python program and more importantly to be get the relevant
variables I will need for my research work going forward.
I will, therefore, call the new data csv file for the assignment: gapminder_ghana_updated.csv
This will be the Gapminder csv data file I will be calling and loading into my
python program
The gapminder_ghana_updated.csv dataset csv for this project can be viewed and dowloaded here:
https://drive.google.com/file/d/0B2KfPRxy4ootQ0pKN3BUMldFUUE/view?usp=sharing
see screenshot here for guide (http://prntscr.com/9gctxn)
Data Variables
All the data variables I worked with on the Gapminder dataset are all quantitative so they are ideal for Generating a Pearson Correlation
Coefficient. However for the purposes of this assignment I will need a
categorical moderator variable.
I will therefore chose the variable, inflation and convert that to a categorical variable.
Inflation will be categorised into 3 groups:
1. LOW inflation group
2. MEDIUM inflation group
3. HIGH inflation group
The Research Question
The same research question which was used for the Generating a
Pearson Correlation Coefficient, assignment is being used here. This was:
Is there an association or relation between Income Per Person and Life Expectancy of the people of Ghana.
For the purpose of this assignment the research question is, does inflation moderate the association or relation between Income Per Person and Life Expectancy of the people of Ghana.
Sample:
Sample is the data from the Gapminder dataset with focus on Ghana
Exploring Statistical Interactions – Testing the Moderator:
This is done by Running Pearson Correlation test on the variables in the research question.
I run this test by using the Python program.
PYTHON PROGRAM CODE:
|
1 2 3 4 5 6 7 8 9 10 11 12 13 14 15 16 17 18 19 20 21 22 23 24 25 26 27 28 29 30 31 32 33 34 35 36 37 38 39 40 41 42 43 44 45 46 47 48 49 50 51 52 53 54 55 56 57 58 59 60 61 62 63 64 65 66 67 68 69 70 71 72 73 74 75 76 77 78 79 80 81 82 83 84 85 86 87 88 89 90 91 92 93 94 95 96 97 98 99 100 101 102 103 104 105 106 107 108 109 110 111 112 113 114 115 116 117 118 119 120 121 122 123 124 125 126 127 128 129 130 131 132 133 134 135 136 137 138 139 140 141 142 143 144 145 146 147 148 149 150 151 152 153 154 155 156 157 158 159 160 161 162 163 164 165 166 167 168 169 170 171 172 173 174 175 176 177 178 179 180 181 182 183 184 185 186 187 188 189 190 191 192 193 194 195 196 197 198 199 200 201 202 203 204 205 206 207 208 209 210 211 212 213 214 215 216 217 218 219 220 221 222 223 224 225 226 227 228 229 230 231 232 233 234 235 236 237 238 239 240 241 242 243 244 245 246 247 248 249 250 251 252 253 254 255 256 257 258 259 260 261 262 263 264 265 266 267 268 269 270 271 272 273 274 275 276 277 278 279 280 281 282 283 284 285 286 287 288 289 290 291 292 293 294 295 296 297 298 299 300 301 302 303 304 305 306 307 308 309 310 311 312 313 314 315 316 317 318 319 320 321 322 323 324 325 326 327 328 329 330 331 332 333 334 335 336 337 338 339 340 |
# -*- coding: utf-8 -*- """ Created on Fri Jan 22 10:00:22 2016 @author: Bernard """ import pandas import numpy import seaborn import scipy import matplotlib.pyplot as plt data = pandas.read_csv('gapminder_ghana_updated.csv', low_memory=False) #setting variables you will be working with to numeric data['incomeperperson'] = data['incomeperperson'].convert_objects(convert_numeric=True) data["lifeexpectancy"] = data["lifeexpectancy"].convert_objects(convert_numeric=True) data["inflation"] = data["inflation"].convert_objects(convert_numeric=True) #replacing missen values with Nan data['incomeperperson']=data['incomeperperson'].replace('', numpy.nan) data['lifeexpectancy']=data['lifeexpectancy'].replace('', numpy.nan) data['inflation']=data['inflation'].replace('', numpy.nan) print (" ") print (" ") print ("association between incomeperperson and lifeexpectancy of Ghana") print (scipy.stats.pearsonr(data['incomeperperson'], data['lifeexpectancy'])) print (" ") print (" ") #describe inflation category print("describe inflation Group") desc1 = data["inflation"].describe() print(desc1) #grouping the inflation figures into groups of 1 , 2 and 3 # figure group 1 represents LOW inflation group # figure group 2 represents MEDIUM inflation group # figure group 3 represents MEDIUM inflation group def inflationGrp (row): if row['inflation'] <= 30: return 1 elif row['inflation'] <= 60 : return 2 elif row['inflation'] > 60: return 3 data['inflationGrp'] = data.apply (lambda row: inflationGrp (row),axis=1) print (" ") print (" ") print ("Print and count all the values in inflationGrp ") chk1 = data['inflationGrp'].value_counts(sort=False, dropna=False) print(chk1) sub1=data[(data['inflationGrp']== 1)] sub2=data[(data['inflationGrp']== 2)] sub3=data[(data['inflationGrp']== 3)] print (" ") print (" ") print("Check what values and how many of it in sub1") valuesInSub1= sub1["inflationGrp"].value_counts(sort=False, dropna=False) print("value," "quantity") print( valuesInSub1) print (" ") print (" ") print("Check what values and how many of it in sub2") valuesInSub2= sub2["inflationGrp"].value_counts(sort=False, dropna=False) print("value," "quantity") print( valuesInSub2) print (" ") print (" ") print("Check what values and how many of it in sub3") valuesInSub3= sub3["inflationGrp"].value_counts(sort=False, dropna=False) print("value," "quantity") print( valuesInSub3) print (" ") print (" ") print ('association between incomeperperson and lifeexpectancy for LOW inflation period') print (scipy.stats.pearsonr(sub1['incomeperperson'], sub1['lifeexpectancy'])) print (" ") print ('association between incomeperperson and lifeexpectancy for MIDDLE inflation period') print (scipy.stats.pearsonr(sub2['incomeperperson'], sub2['lifeexpectancy'])) print (" ") print ('association between incomeperperson and lifeexpectancy for HIGH inflation period') print (scipy.stats.pearsonr(sub3['incomeperperson'], sub3['lifeexpectancy'])) #creating the 3 different axes where the 3 plotting illustrations will display fig = plt.figure() ax1 = fig.add_subplot(311) ax2 = fig.add_subplot(312) ax3 = fig.add_subplot(313) scat1 = seaborn.regplot(x="incomeperperson", y="lifeexpectancy",fit_reg=True, data=sub1, ax=ax1) plt.xlabel('Income Per Person') plt.ylabel('Life Expectancy') plt.title('Scatterplot for the Association Between Income Person and Life Expectancy for LOW inflation period') print (scat1) scat2 = seaborn.regplot(x="incomeperperson", y="lifeexpectancy", fit_reg=True, data=sub2, ax=ax2) plt.xlabel('Income Per Person') plt.ylabel('Life Expectancy') plt.title('Scatterplot for the Association Between Income Person and Life Expectancy for MIDDLE inflation period') print (scat2) scat3 = seaborn.regplot(x="incomeperperson", y="lifeexpectancy", fit_reg=True, data=sub3, ax=ax3) plt.xlabel('Income Per Person') plt.ylabel('Life Expectancy') plt.title('Scatterplot for the Association Between Income Person and Life Expectancy for HIGH inflation period') print (scat3) |
CODE OUTPUT:
<<<<<<<<<<<<<
CODE OUTPUT BEGIN
>>>>>>>>>>>>>>>>>>>
association between
incomeperperson and lifeexpectancy of Ghana
(0.84735157770557723,
9.6218092417241115e-61)
describe inflation Group
count 51.000000
mean 27.678454
std 23.026594
min -3.884508
25% 14.160658
50% 20.872222
75% 34.110396
max 123.061204
Name: inflation, dtype:
float64
Print and count all the
values in inflationGrp
NaN 165
1
34
2
12
3
5
Name: inflationGrp, dtype:
int64
Check what values and how
many of it in sub1
value,quantity
1 34
Name: inflationGrp, dtype:
int64
Check what values and how
many of it in sub2
value,quantity
2 12
Name: inflationGrp, dtype:
int64
Check what values and how
many of it in sub3
value,quantity
3 5
Name: inflationGrp, dtype:
int64
association between
incomeperperson and lifeexpectancy for LOW inflation period
(0.38729766841663288,
0.023637021944065272)
association between incomeperperson
and lifeexpectancy for MIDDLE inflation period
(0.23254698923559289,
0.46702325083631474)
association between
incomeperperson and lifeexpectancy for HIGH inflation period
(0.69386253594491076,
0.19372441816192137)
Axes(0.125,0.672059;0.775×0.227941)
Axes(0.125,0.398529;0.775×0.227941)
Axes(0.125,0.125;0.775×0.227941)


<<<<<<<<<<<<<
CODE OUPUT ENDED
>>>>>>>>>>>>>>>>>>>
DRAWING CONCLUSION (SUMMARY):
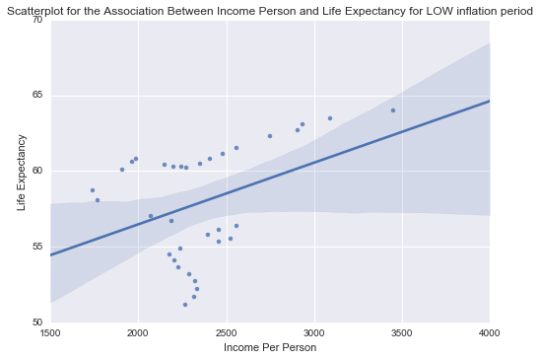
The LOW inflation group
From the output of the
code, it can be seen that the p-value for the LOW inflation group
is p-value = 0.023637021944065272 and it is far less than the
statistically and scientifically testing value of 0.05 (or 5%). And the Pearson Correlation Coefficient, r = 0.38729766841663288. The “r” value indicates the relationship is
positive and this is further emphasized by the Scatterplot for the Association Between Income Person and Life
Expectancy for LOW inflation period which is depicted by the first image
above
The MIDDLE inflation group
From the output of the
code, it can be seen that the p-value for the MIDDLE inflation group
is p-value = 0.46702325083631474 which when approximated will be equal
to the statistically and scientifically testing value of 0.05 (or 5%). And the Pearson Correlation Coefficient, r = 0.23254698923559289.
Though
the relationship is positive, a closer
examination of the Scatterplot for the Association Between Income Person and
Life Expectancy for MIDDLE inflation period which is depicted by
the second image above shows that the plots are not linear. It is kind of curvy
in nature
This means that the Pearson Correlation Coefficient is useless in examination the
data in the plot as the Pearson Correlation Coefficient is only used for linear
graphs. Hence I cannot analyse the moderator for the MIDDLE inflation group using
the Pearson Correlation Coefficient.
The HIGH inflation group
From the output of the
code, it can be seen that the p-value for the HIGH inflation group is p-value
= 0.19372441816192137 and it is far less than the statistically and
scientifically testing value of 0.05 (or 5%). And the Pearson Correlation Coefficient, r = 0.69386253594491076. The “r”
value indicates the relationship is positive and this is further emphasized by
the Scatterplot for the Association
Between Income Person and Life Expectancy for HIGH inflation period which
is depicted by the third image above
Concluding on the Potential
Moderator
From the analyses above, it is seen clearly that for both
the LOW and HIGH inflation groups the association
or relation between Income Per Person and Life Expectancy of the people of Ghana
is not being moderated by inflation.
That is to say inflation
does not moderate the association between Income Per Person and Life Expectancy
of the people of Ghana.
This is because, there is
a still an increase in the Life Expectancy of the people of Ghana as long as
there is an increase in the Income Per Person regardless of whether there is a LOW or HIGH inflation.