I was working on a Kaggle.com competition about sales forecasting and realised there are a lot of libraries in “R” that do a lot of forecasting and generally make forecasting pretty straight forward.
What is “R” in the first place in the sphere of statistics and Data Science:
R is a programming language and software environment for statistical computing and graphics supported by the R Foundation for Statistical Computing. The R language is widely used among statisticians and data miners for developing statistical software[5] and data analysis
(https://en.wikipedia.org/wiki/R_(programming_language))
I, therefore, decided to pick up the R language. I searched on Google and read a couple of articles and watched a couple of Youtube videos.
The one that gave me a great introduction was (the entire 18 series by TheNewBoston)
After that I did a couple of Time Series simple projects using inbuilt library data in R example being the AirPassengers .
There was also a great explanation of the concept by Analytics Vidya which can be found here:
I am also impressed and astonished by the flexibility of R. There are great inbuilt libraries and resources which make analysis simple and easy. It is actually a great program for Data Science and Statistics
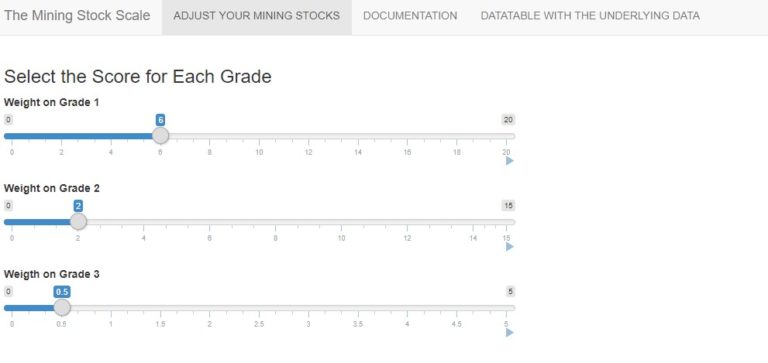
These are some simple R publishes I have so far done with the intro intoduction to R
I will be using R and Python interchangeably on my future data analysis and data science works.

