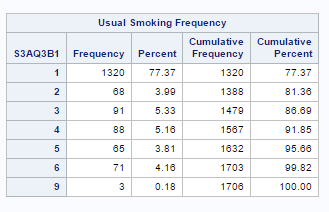
Run Explore Frequency Distribution of Your Dataset in SAS Studio
SAS Studio is a very powerful statistical program which are used by many corporations for various analytic and data science…
SAS Studio is a very powerful statistical program which are used by many corporations for various analytic and data science…
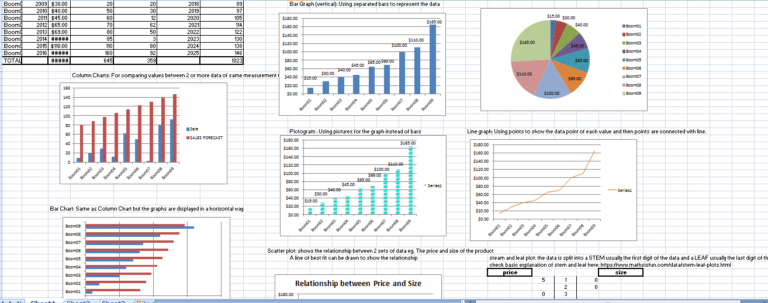
Sometimes, you need some charts to explore your data and many times when your analysis is done and you want…
For a refresher tutorial or quick look up on INDEX and MATCH Functions in Excel, ExcelIsFun on Youtube explains it very clearly with great…
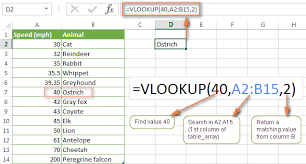
A friend of mine asked me to take him through VLookUp Excel function. VLookUp is a powerful function in Excel…
Chosen Dataset I will be working with Data from the Gapminder dataset. This happens to be the same dataset I worked…
An experienced DevOps and Cloud Training Company to meet your DevOps and Cloud needs
You can see how this popup was set up in our step-by-step guide: https://wppopupmaker.com/guides/auto-opening-announcement-popups/
On this website we use first or third-party tools that store small files (cookie) on your device. Cookies are normally used to allow the site to run properly (technical cookies), to generate navigation usage reports (statistics cookies) and to suitable advertise our services/products (profiling cookies). We can directly use technical cookies, but you have the right to choose whether or not to enable statistical and profiling cookies. Enabling these cookies, you help us to offer you a better experience.