data science

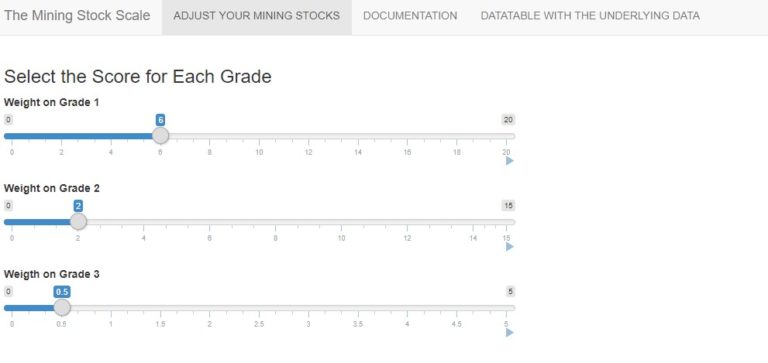
R Shiny App for Mining Fields Evaluation
|

R Shiny App for Mining Fields Evaluation

Presenting your report in an interactive and user-friendly way is a very effective communicative tool which can help you convey message to your audience easily. R is a very powerful analytic tool which helps you to do that with the “shiny” package. Here, I simply look at an app about the Mining Fields Evaluation which was…

Run Your Python and R Codes Online For Your Data Science and Machine Learning Projects Mini Projects For Free
| |

Run Your Python and R Codes Online For Your Data Science and Machine Learning Projects Mini Projects For Free

Sometimes, you would want to easily access and run your Python and R codes wherever you find yourself in the world once you have internet access. This is really handy when you have a mini-project you are working on , or you are going through an online tutorial, or you are trying to teach or…

SQLSaturday Manchester 15th July 2017 Event- My Experience
|

SQLSaturday Manchester 15th July 2017 Event- My Experience

So I was at the SQLSaturday event in Manchester, United Kingdom on the 15th July 2017. According the SQLSaturday website, SQLSaturday is a training event for SQL Server professionals and those wanting to learn about SQL Server. Admittance to this event is free, and most costs are covered by donations and sponsorships.   I would,…

ImportError: No module named learn.base Crab Python Fix

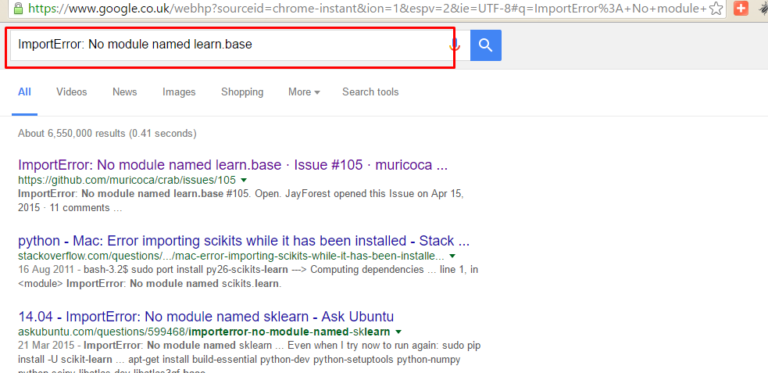
ImportError: No module named learn.base Crab Python Fix

I was working on Recommender System and had a problem when i tried importing from scikits.crab.recommenders.knn import UserBasedRecommender. I encountered the following error ImportError: No module named learn.base I did research on the web and found one good solution but it was in Chinese. Here is the link and credit to the original fixer :…

| |

Running a Random Forest – Data Analysis and Intrepretation

Overview My research work deals with Ghana, a country from the Gapminder dataset as has already been discussed from the beginning and progression through this course. The variables in my observation dataset are all quantitative. For the purposes of this assignment, I have binned my quantitative target variable, Life Expectancy (lifeexpectancy) into a 2-level binary categorical target variable. I have named…

|

Generating a Correlation Coefficient – Data Analysis and Intrepretation

Chosen Dataset I will be working with Data from the Gapminder dataset. This happens to be the same dataset I worked with under the Data Management and Visualization course assignments. As elaborated and discussed in under the Data Management and Visualization course assignments, I have chosen to focus on the country, Ghana. Hence I will be particularly interested in…

|

Association Of The Literacy Rate And Life Expectancy & Association Of The Literacy Rate And Income Per Person: The Case of Ghana

Background of the Dataset CSV file Used:   In the GapMinder Codebook the Unique        Identifier = Country Hence in this program, my Unique Identifier = Ghana 1.      There are 3 chosen variables (columns) that are core to my chosen research question which is based on the country Ghana. These are a.       incomeperperson b.      lifeexpectancy…